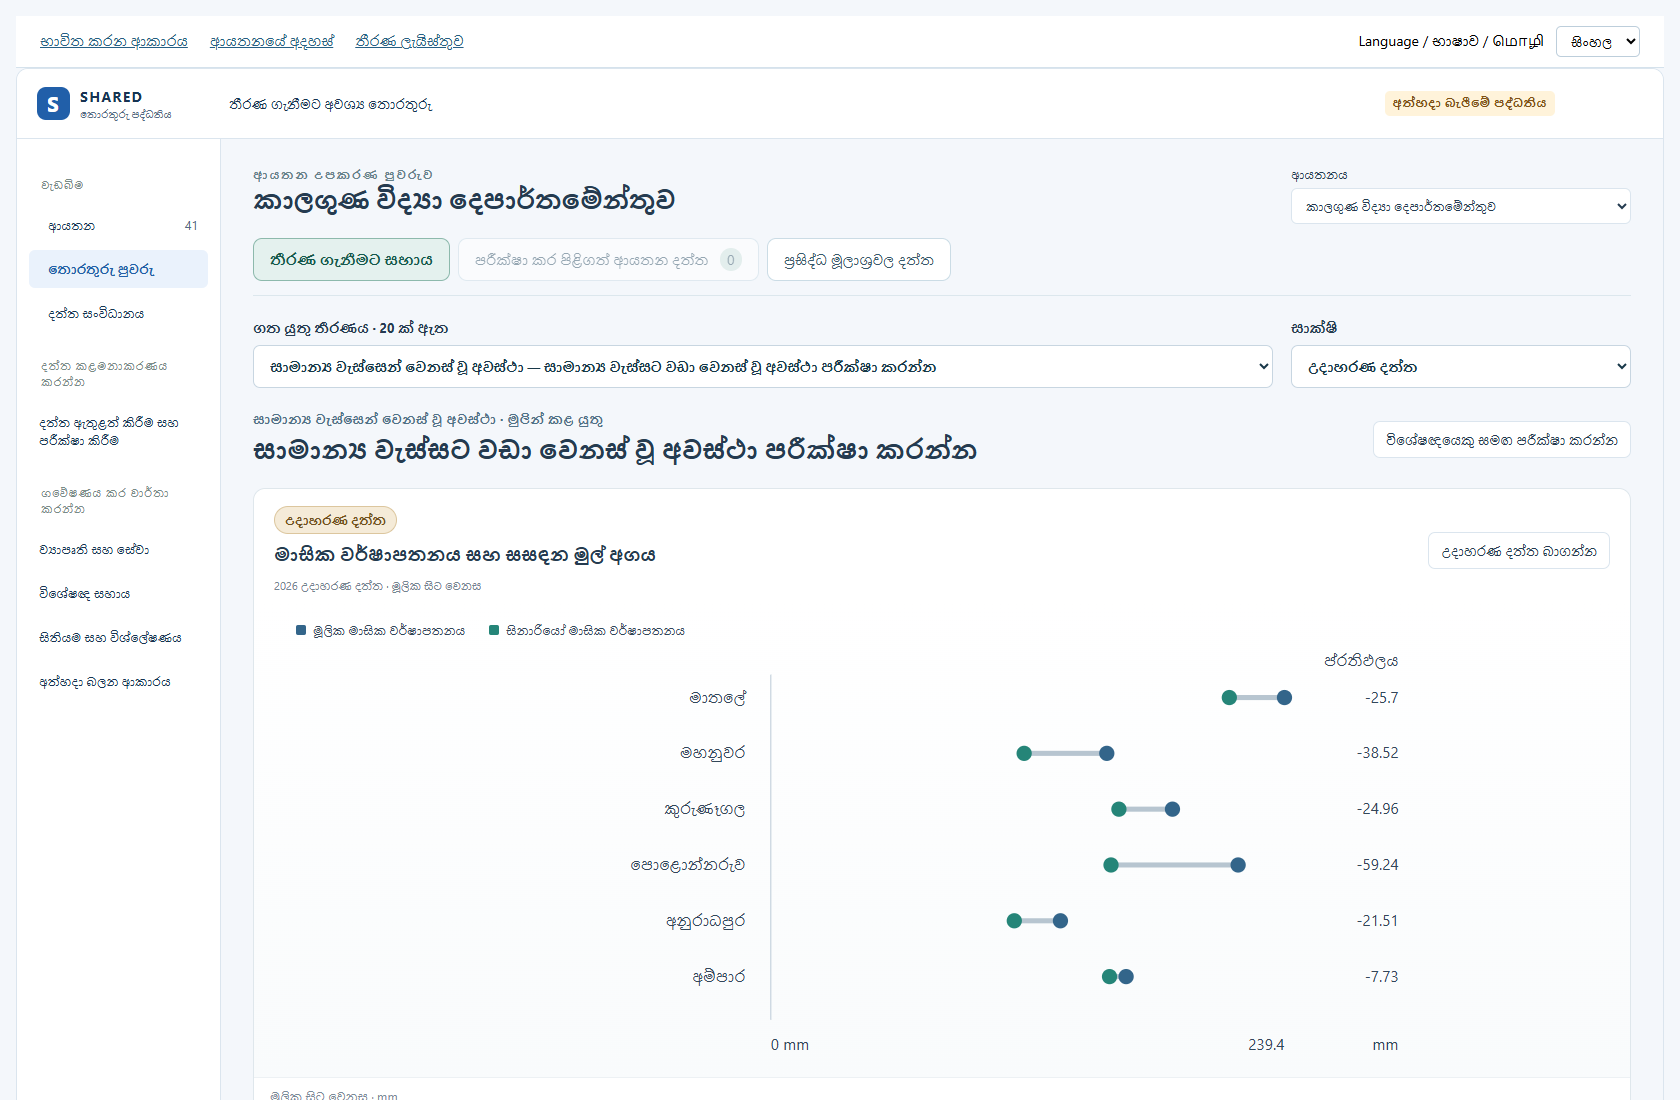
1. Open the prototype
Open sharedproto.wkslabs.com. Test drafts and files stay in this browser and website address. Use example details during review.
Continue answers from the earlier review address
Open the earlier review address in the same browser. Download your institution review answers there. Open the same institution document at this address, then use Import answers. Keep the downloaded copy. Saved test drafts are not automatically moved between addresses.
Try one full journey: choose an institution and decision → enter or upload its inputs → submit them → review and accept them → open the matching chart → build a report. For map records, use Spatial records and its separate review steps.
See the workflow and chart check results. This shows what was tested locally and what still needs a real service or institution approval.
Use the left menu to choose a main area. Use the buttons at the top of that area to change its view. The highlighted button shows where you are. Browser Back and Forward return to the previous and next screens. You can copy the page link to open the same work area again.
| Where to go | What to do |
|---|---|
| Dashboards | See decisions, charts and their evidence. |
| Data structure | Follow the existing data tree. |
| Data workspace | Enter data, upload a file, see the API plan, or open Records & review. |
| Projects and services | Choose a work group, then its Workspace. |
| Experts hub | Open the decision library, report builder or advice requests. |
| Spatial data | Open map layers, spatial records, layer types or the review queue. |
| Workflow guide | See the available work steps inside the prototype. |
Switching views keeps unfinished forms during the current session. Choose Save draft or Save report when you want to keep work in this browser. An unsaved form may be lost if you reload or close the page. Changing the institution or preview role shows that selection’s work; it must not copy the previous institution’s records.
- Open the SHARED prototype.
- Choose your institution. Open Dashboards if you are on another screen.
- Choose English, සිංහල or தமிழ் at the top.
- Choose a decision. Each institution has 20 proposed decisions.
Use the top links to return to this guide, your institution review document or the full decision register. The guide and review forms use simple English. The prototype controls also support Sinhala and Tamil.
Use a desktop browser. Keep the same browser for your saved drafts. Records made for testing stay in that browser. They do not change the main SHARED system.
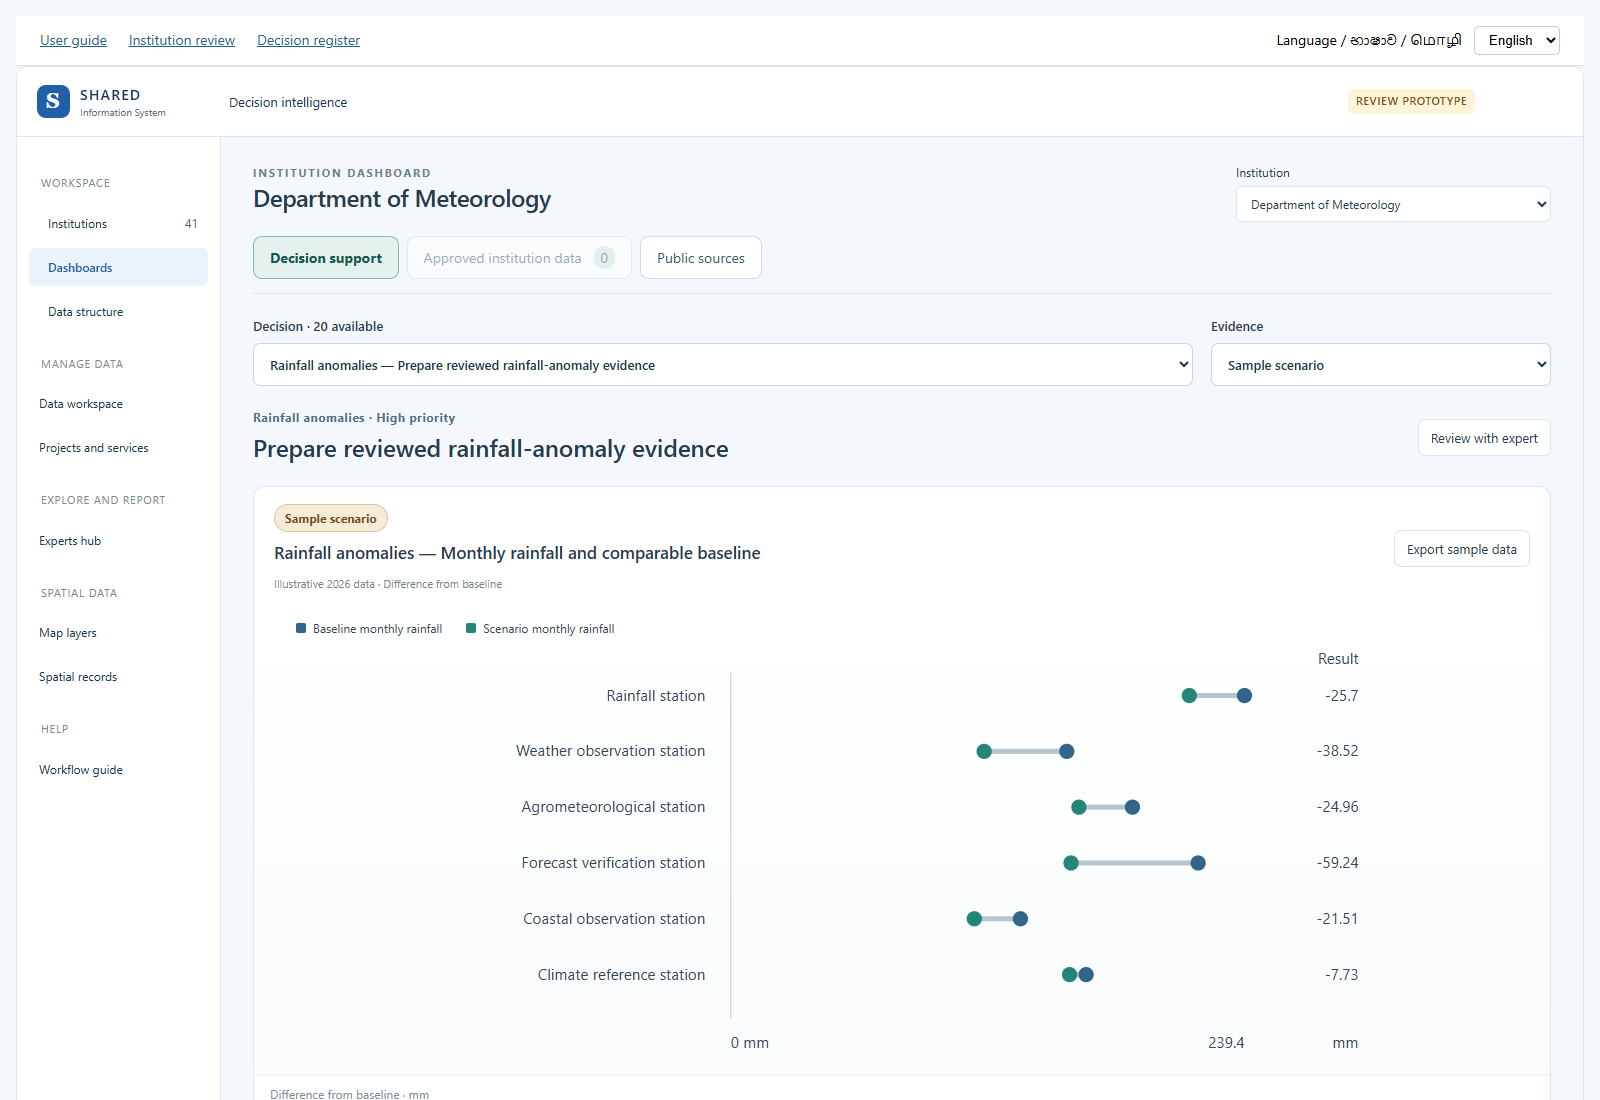
2. Read and test a chart
The main decision screen shows accepted inputs for that decision when available. Otherwise it shows a clearly marked sample. Public source context is a separate choice. It gives useful published information but may not contain all the inputs needed for the chosen calculation.
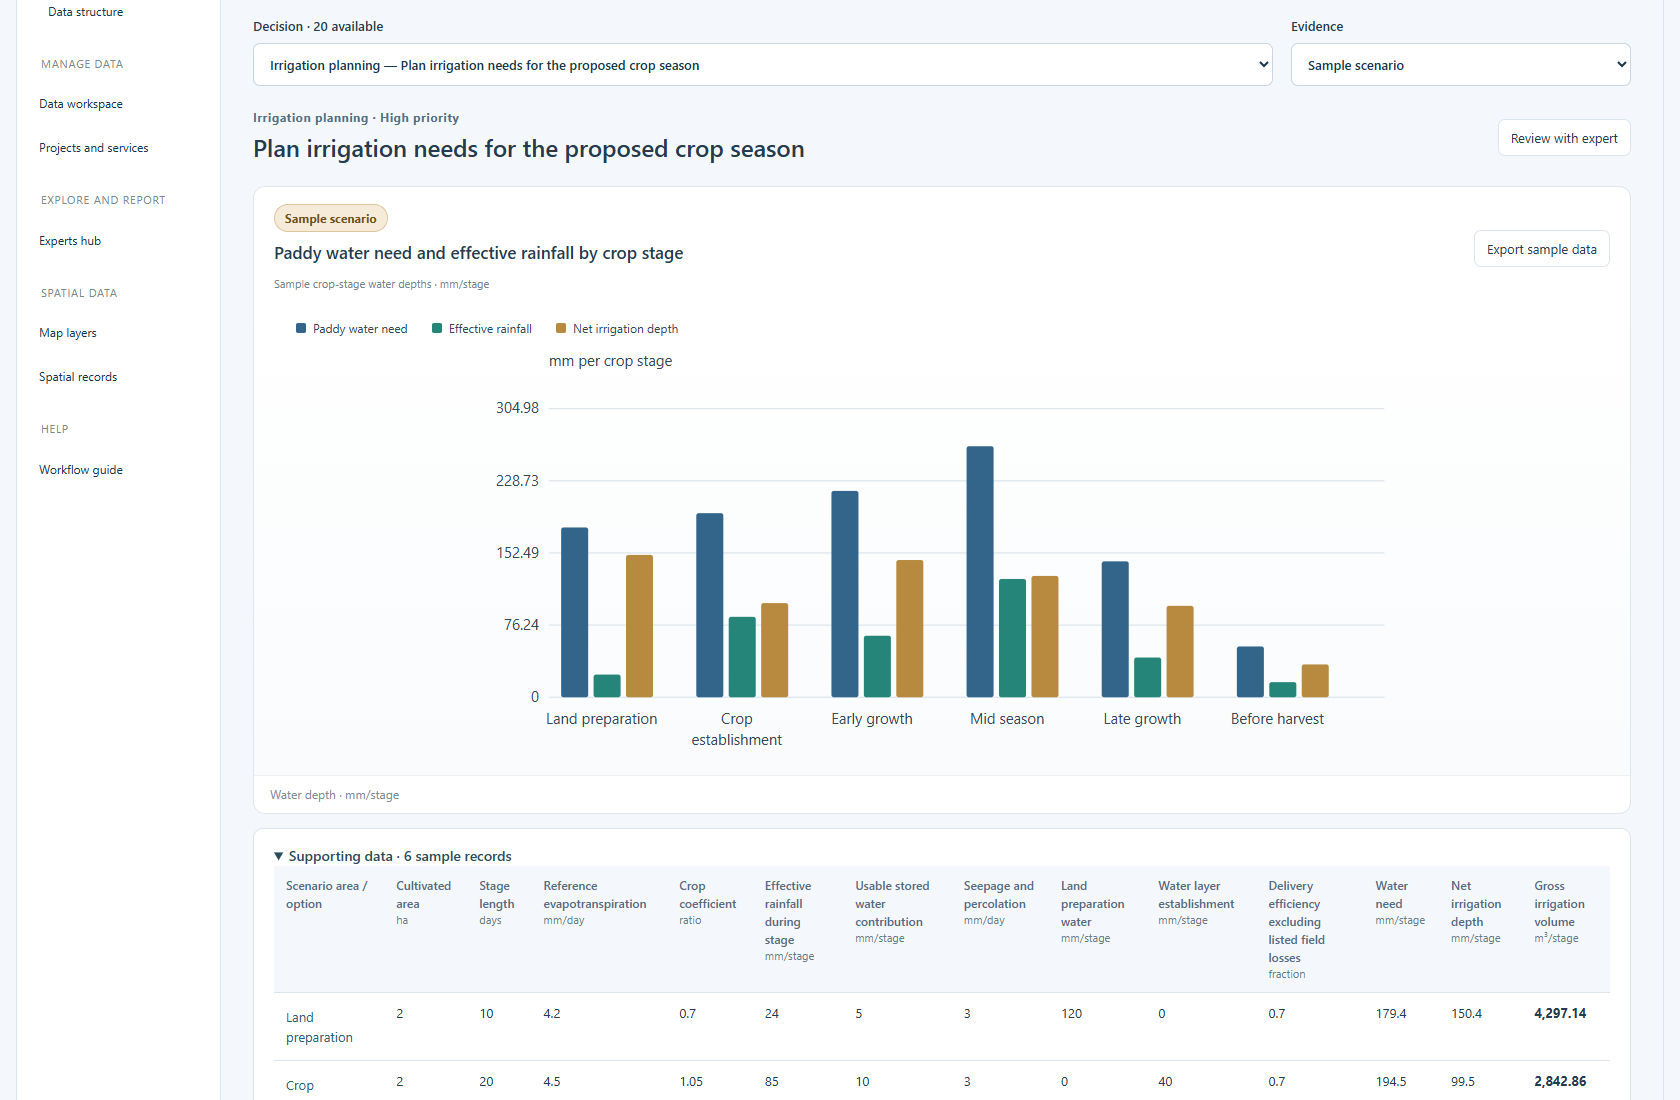
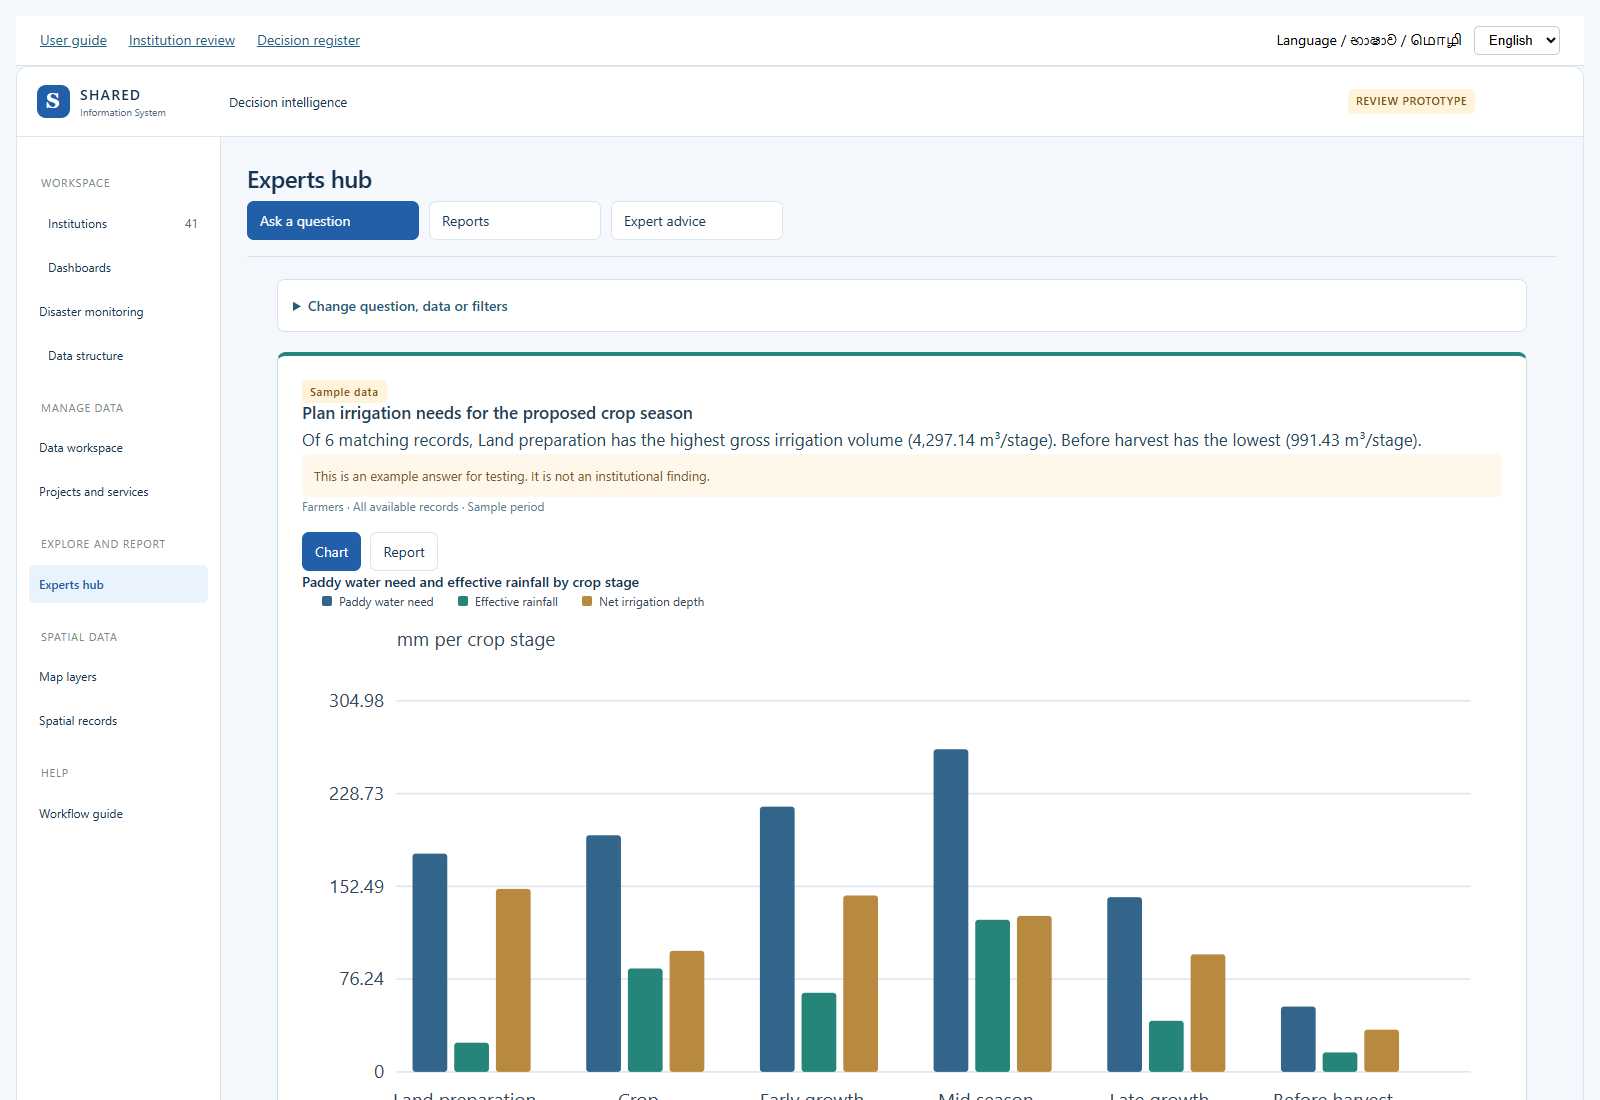
Read the chart title, legend and unit together. The title names what is plotted. For example, the paddy chart compares water need, useful rainfall and the remaining irrigation need for each crop stage. These bars use millimetres. The table also shows the supplied water volume in cubic metres.
Samples stay labeled as samples after review. Accepting sample values does not turn them into measured results. Older saved examples are kept with an earlier-model label; their stored values are not silently changed.
- Open Decision support and select a decision.
- Read the chart title, place, date and unit. Check whether it is public data or a sample.
- Choose Sample scenario under Evidence to try the example calculation.
- Scroll below the chart to see the values and calculation. Change a sample value only when you want to test a different situation.
- Open the source or method details before using the result.
| Label | What it means |
|---|---|
| Public sources | Published source information. Check its date, scope and allowed use. It is not automatically approved for your institution. |
| Sample scenario | Made-up values for testing. Do not report these as measured results. |
| Approved institution data | An accepted version of entered or uploaded records, linked to institution charts. |
| Draft | Not yet checked and accepted. It must not be treated as an approved rule or record. |
If no accepted decision inputs are available, a labeled sample opens immediately. Public sources remain available as supporting context.
3. Understand a formula and its inputs
Paddy water example, in simple steps
Use the same field and crop stage for every input. Enter the stage days, cultivated hectares, daily water-loss value, crop factor, useful rainfall, stored-water contribution, seepage, land preparation, water layer and efficiency.
- Water need = (daily water-loss value × crop factor + daily seepage) × stage days + land preparation + water layer.
- Net irrigation depth = water need − useful rainfall − usable stored water. If the result is below zero, use zero.
- Supplied volume = net irrigation depth × hectares × 10 ÷ efficiency.
Example: a stage needs 194.5 mm. Useful rain supplies 85 mm and stored water supplies 10 mm. Net irrigation is 99.5 mm. For 2 hectares at an efficiency of 0.70, the supplied volume is 2,842.86 m³. Efficiency 0.70 means 70%. Use it for delivery losses not already counted in the field-loss inputs.
The bars compare water depths in mm per stage. The table shows the volume in m³ per stage. Do not compare a daily value with a whole-stage value without converting it. Enter zero only when you know that a term does not apply.
Method references: FAO irrigation water balance and efficiency and Sri Lanka rice water management. The example values are for testing; local staff must check the crop, soil and operating inputs.
A formula shows how numbers become a result. A parameter is simply a number that you put into the formula.
Example: Total cost = Labour cost + Material cost + Transport cost.
If the three costs are 100, 200 and 50 rupees, the result is 350 rupees. Use the same currency and time period for all three numbers.
- Open a decision in the dashboard.
- Choose Sample scenario to try its calculation.
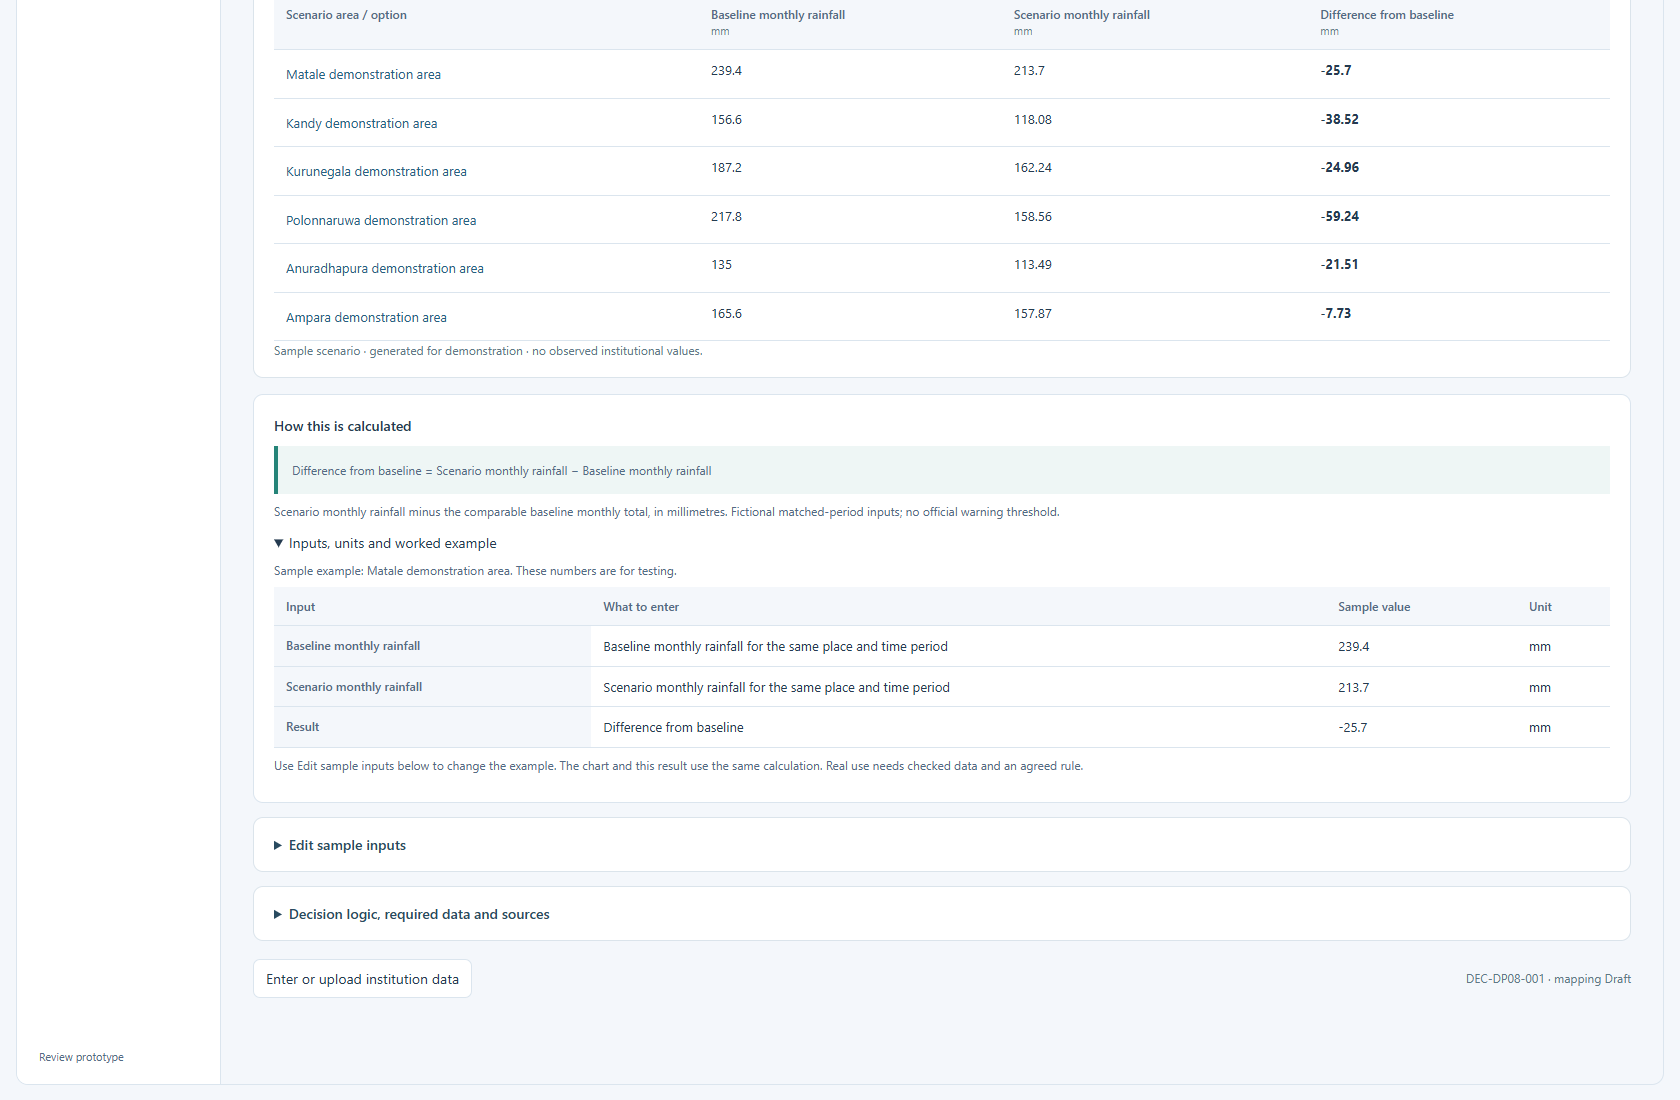
- Find How this is calculated under the chart.
- Read the formula, then open Inputs, units and worked example.
- The table shows each input name, sample value and unit, followed by the result.
- Use Edit sample inputs to change the numbers. Save the sample change and check the new chart and result.
A percentage means a share out of 100. For example, coverage = served places ÷ eligible places × 100. If 30 of 50 places are served, coverage is 60%. Both counts must refer to the same places and period.
Read the rule below the formula. It explains limits such as missing values, matching dates and required review. A public-source chart and a sample calculation can use different inputs; the screen labels the sample separately. A sample calculation does not approve an institutional rule.
4. Check the data structure
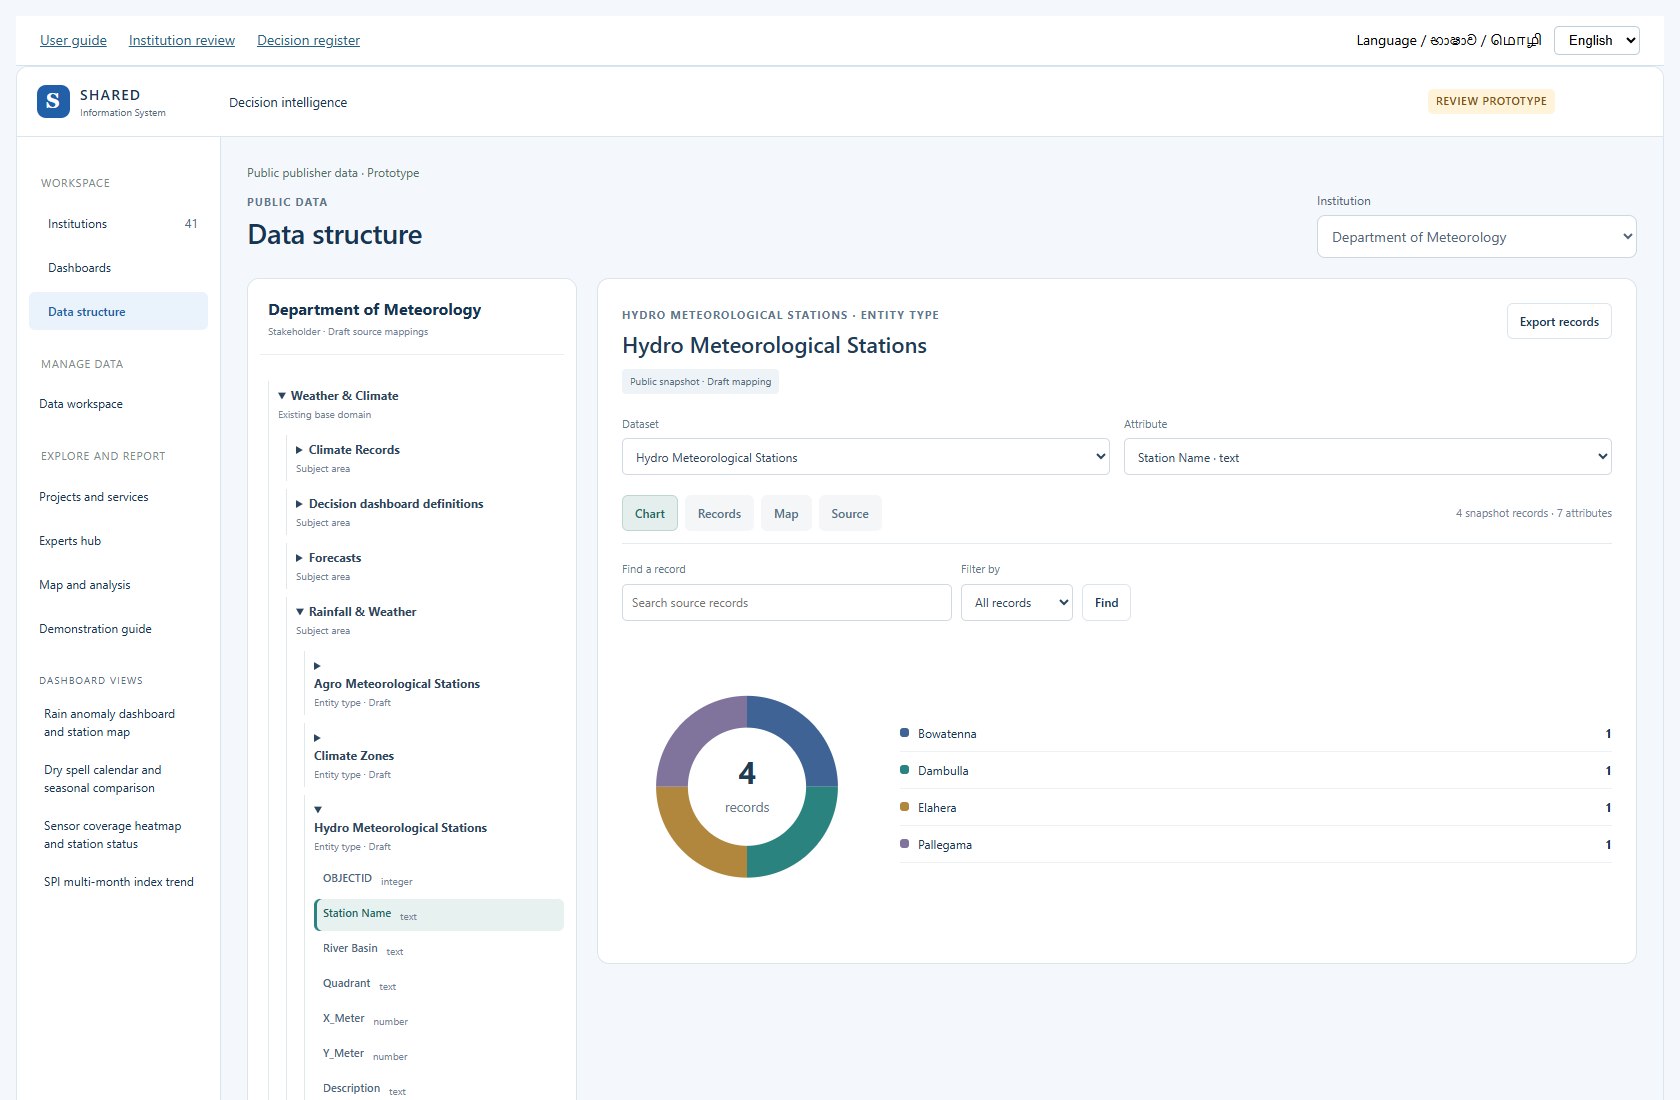
Open Data structure. Follow the tree from the institution to its base domain, subject area, entity type, attribute and data type.
In plain words: start with the organisation, choose a work area, choose a topic, choose what is being recorded, then see the details stored about it. For example: institution → water → rainfall → station → daily rainfall → number.
- Open the relevant branches.
- Check names and definitions.
- Check whether the same item already exists before asking for a new one.
- Record missing fields or incorrect links in your institution review document.
A Draft link is still a proposal. A label with a similar name does not prove that two fields mean the same thing.
5. Manage the data structure
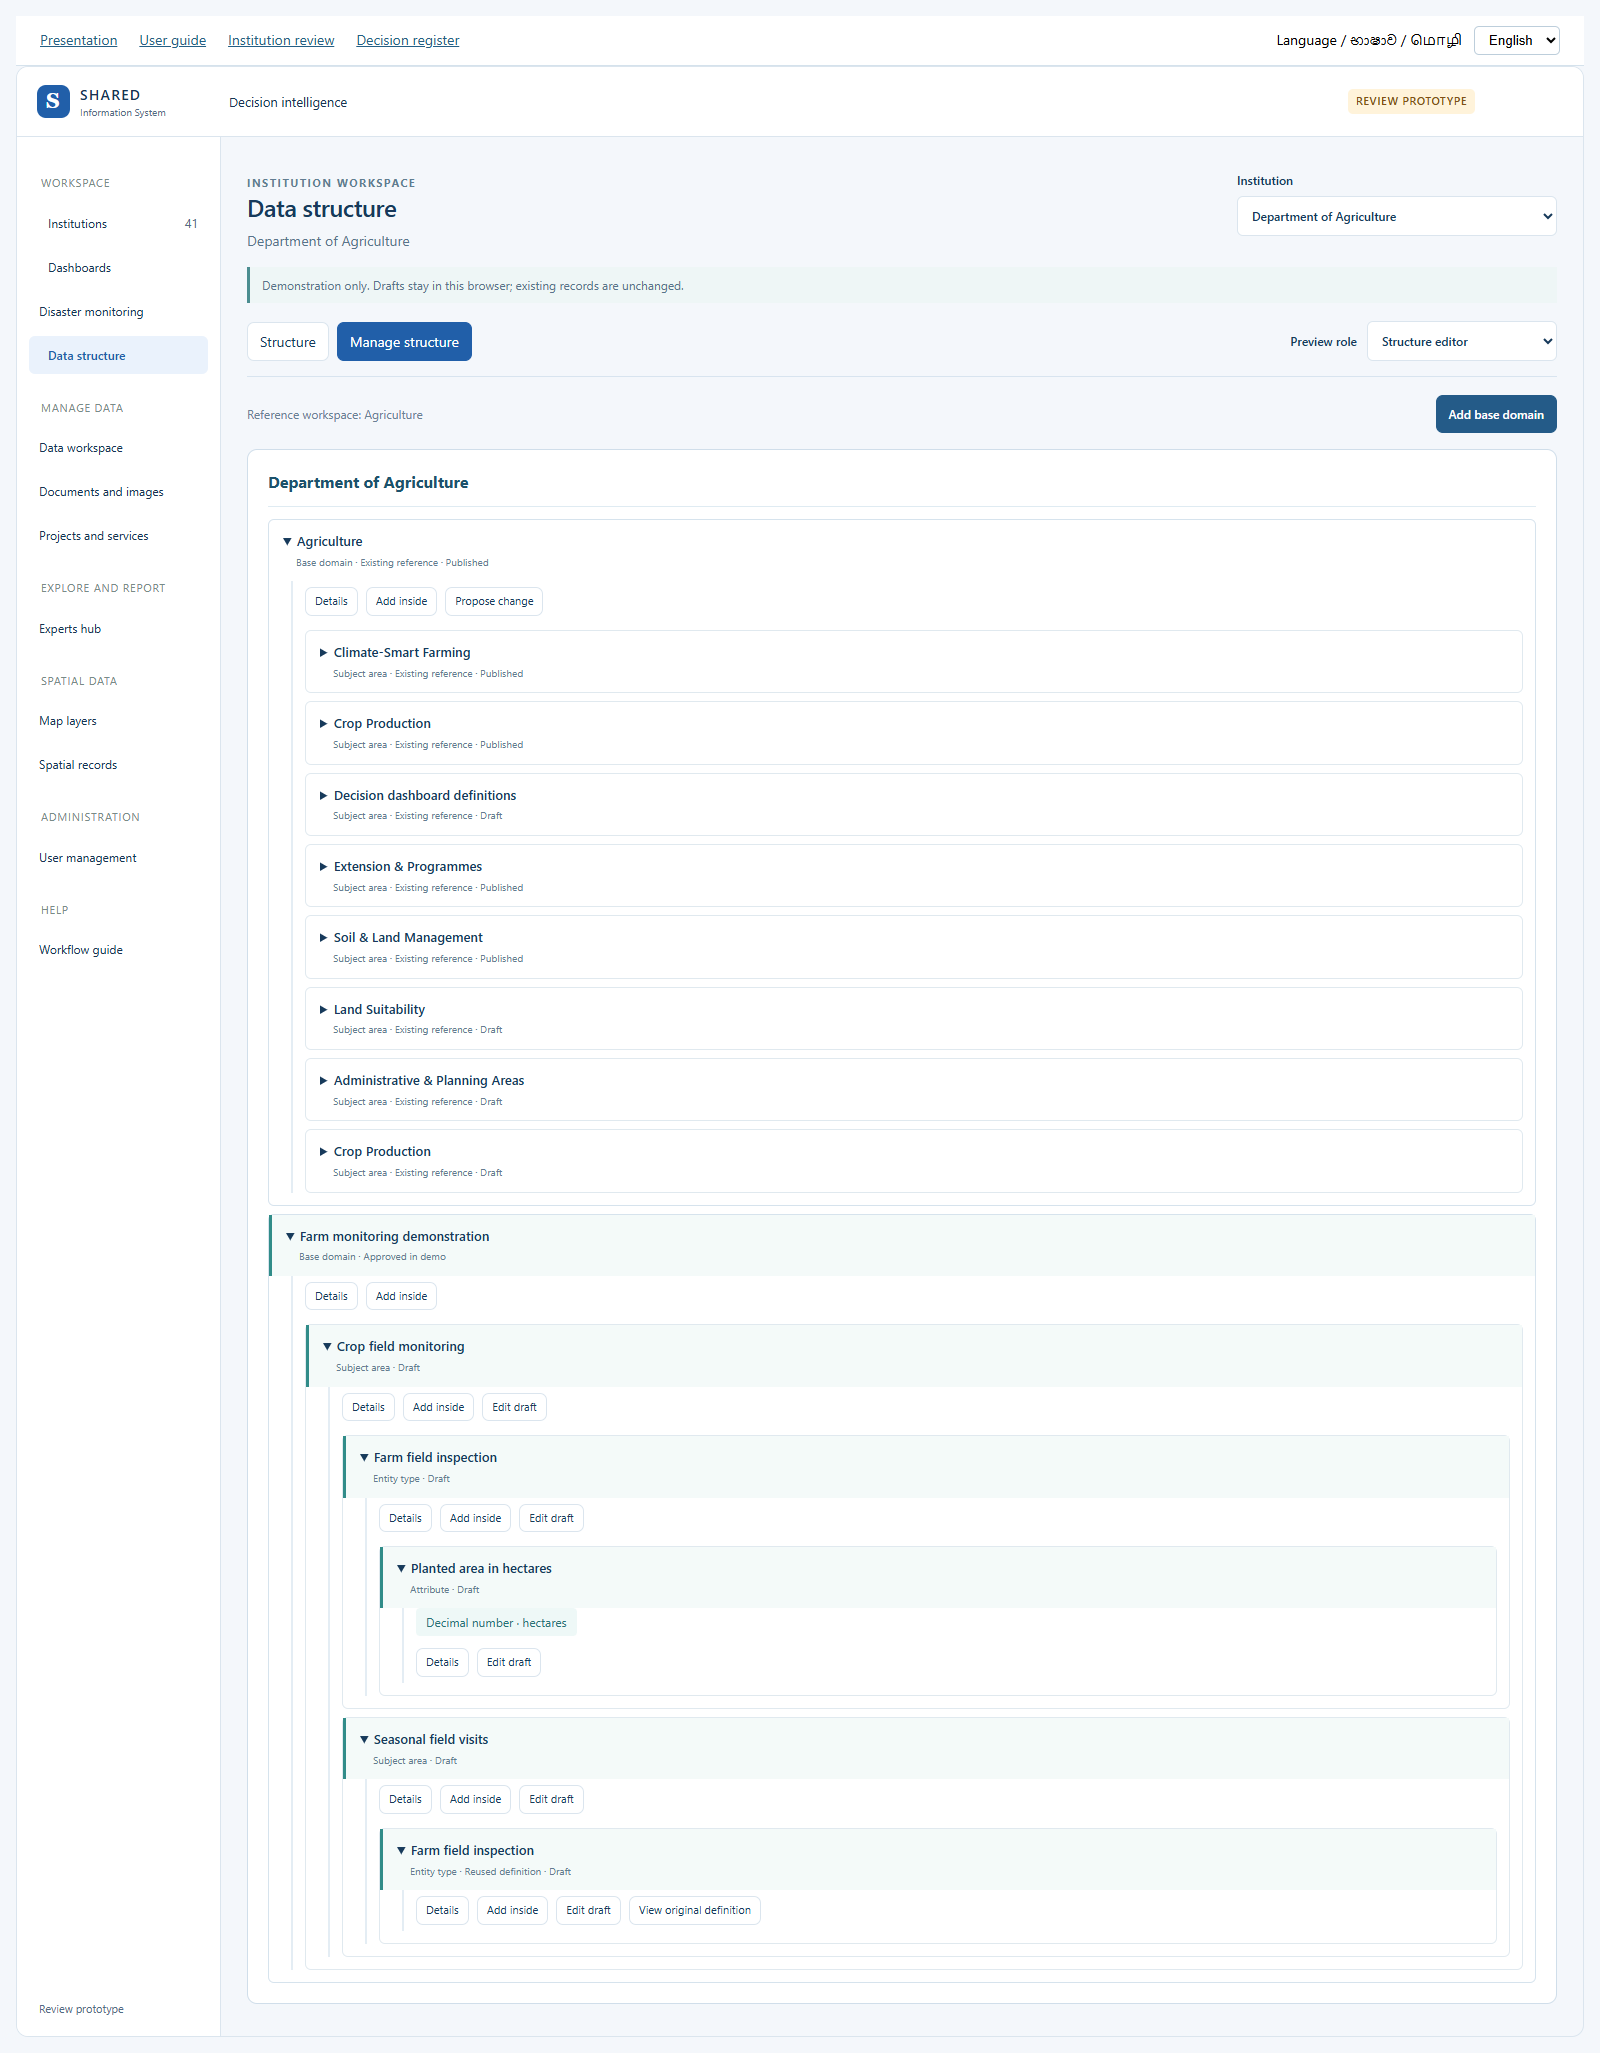
- Open Data structure and choose the institution. Structure keeps the existing source tree, records, charts and map. Manage structure adds the editing demonstration in the same module.
- Choose Manage structure. The tree stays in the same screen. Preview role lets you demonstrate the editor, reviewer or viewer.
- Use Add base domain for a new main information area. Use Add inside to add a subject area, a nested subject, an entity type, or an attribute under the right parent.
- Give a clear name, a stable code and a short meaning. Keep one primary parent. The screen checks repeated names and codes and prevents circular parent links.
- For an attribute, choose its data type and unit. Field rules lets you set limits, decimal places, choices, whether the value is required and how missing values are recorded.
- Use an existing definition when the same entity type or attribute is already available. This adds a reference rather than another copy.
- Select Save draft preview. The new definition appears in the tree as Draft. A reference change is a separate proposal; the original catalogue is preserved.
- Open Details and select Send for review. Switch the preview role to Structure reviewer. Open Review proposals, give a review reason and approve in the demo or return it for correction.
- Draft, submitted and approved-in-demo states are visible in the same tree. Change history shows the demonstration steps. Use the editor role to correct a returned draft.
These are browser-only demonstration drafts. They do not change the real structure, approve a data mapping, alter existing observations or connect a new field to a chart. The reference workspace is context, not proof that an institution owns another institution’s definitions.
Open the data structure demonstration
6. Enter a few records
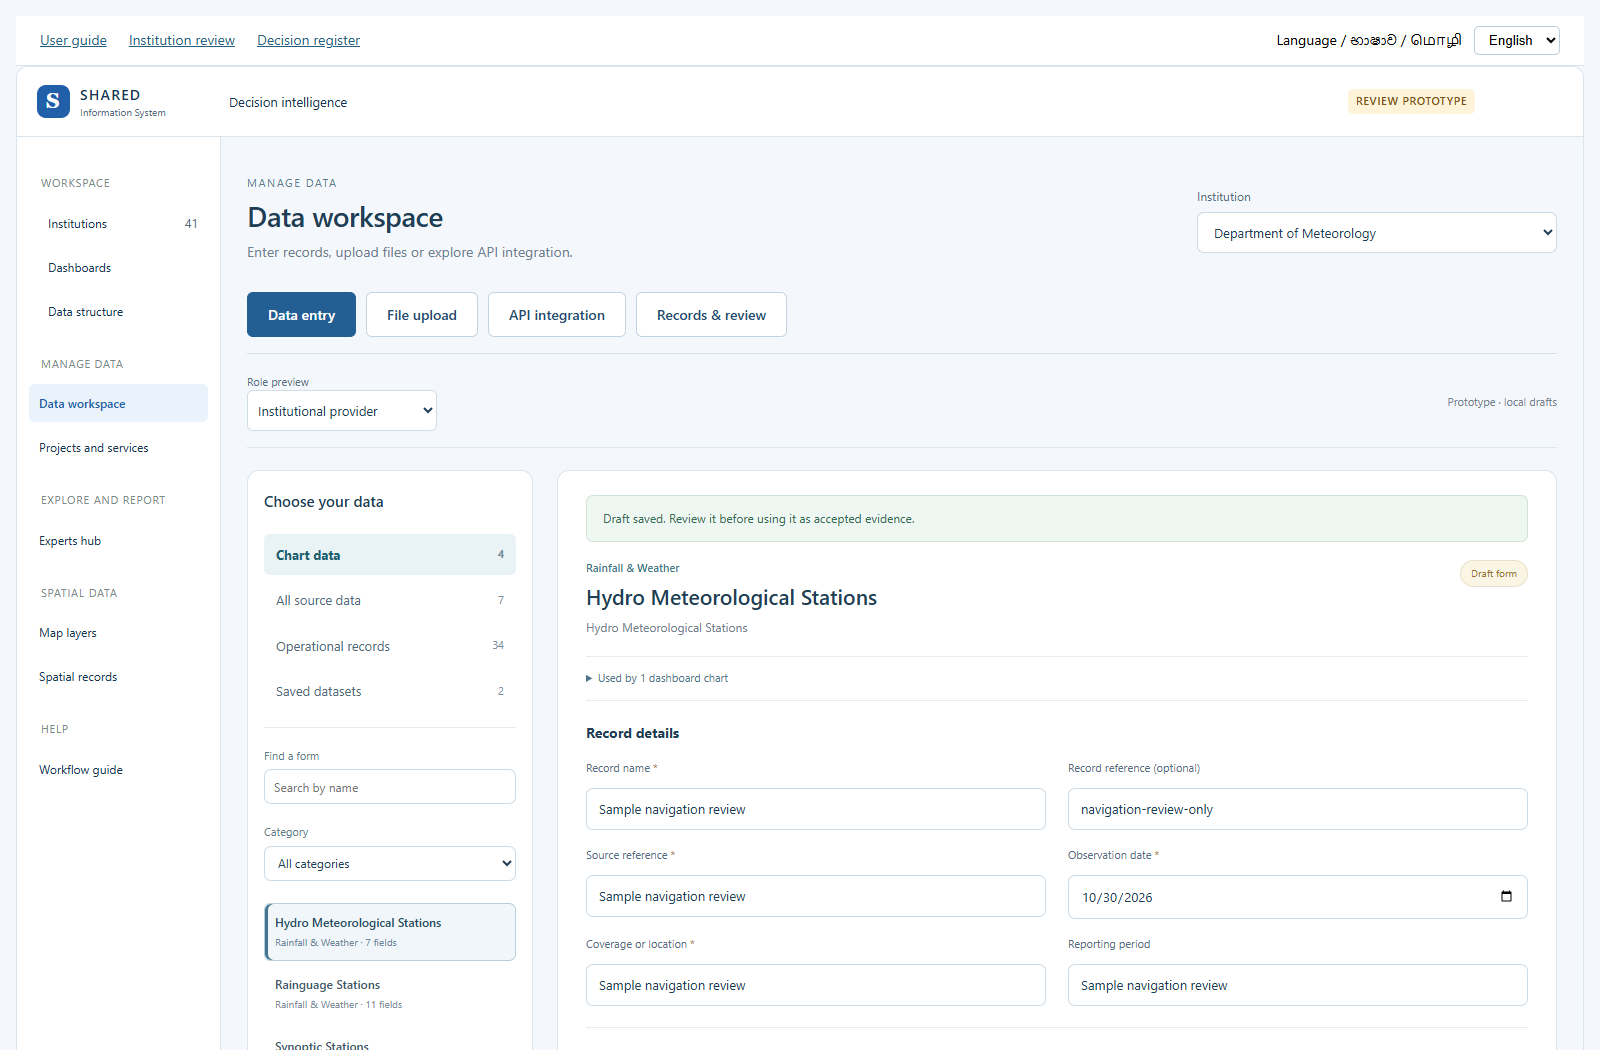
From a decision, choose Enter or upload institution data. Its matching input form opens. In Data workspace you can also choose Decision inputs, then the form and decision. Shared forms are reused; records still belong to the selected decision and institution.
Choose Sample for testing when trying the screen. Use Institution-supplied data only for values from your institution’s source. Give each record a useful name, source, place, date and reporting period. Use a crop-stage name for a paddy stage. Fill every required parameter and check the unit.
Calculation forms need their required inputs before saving. If an input is unknown, check the source first. Do not guess a value or use zero for missing information.
The same four buttons stay at the top: Data entry, File upload, API integration and Records & review. You can move between them without finding a separate return link.
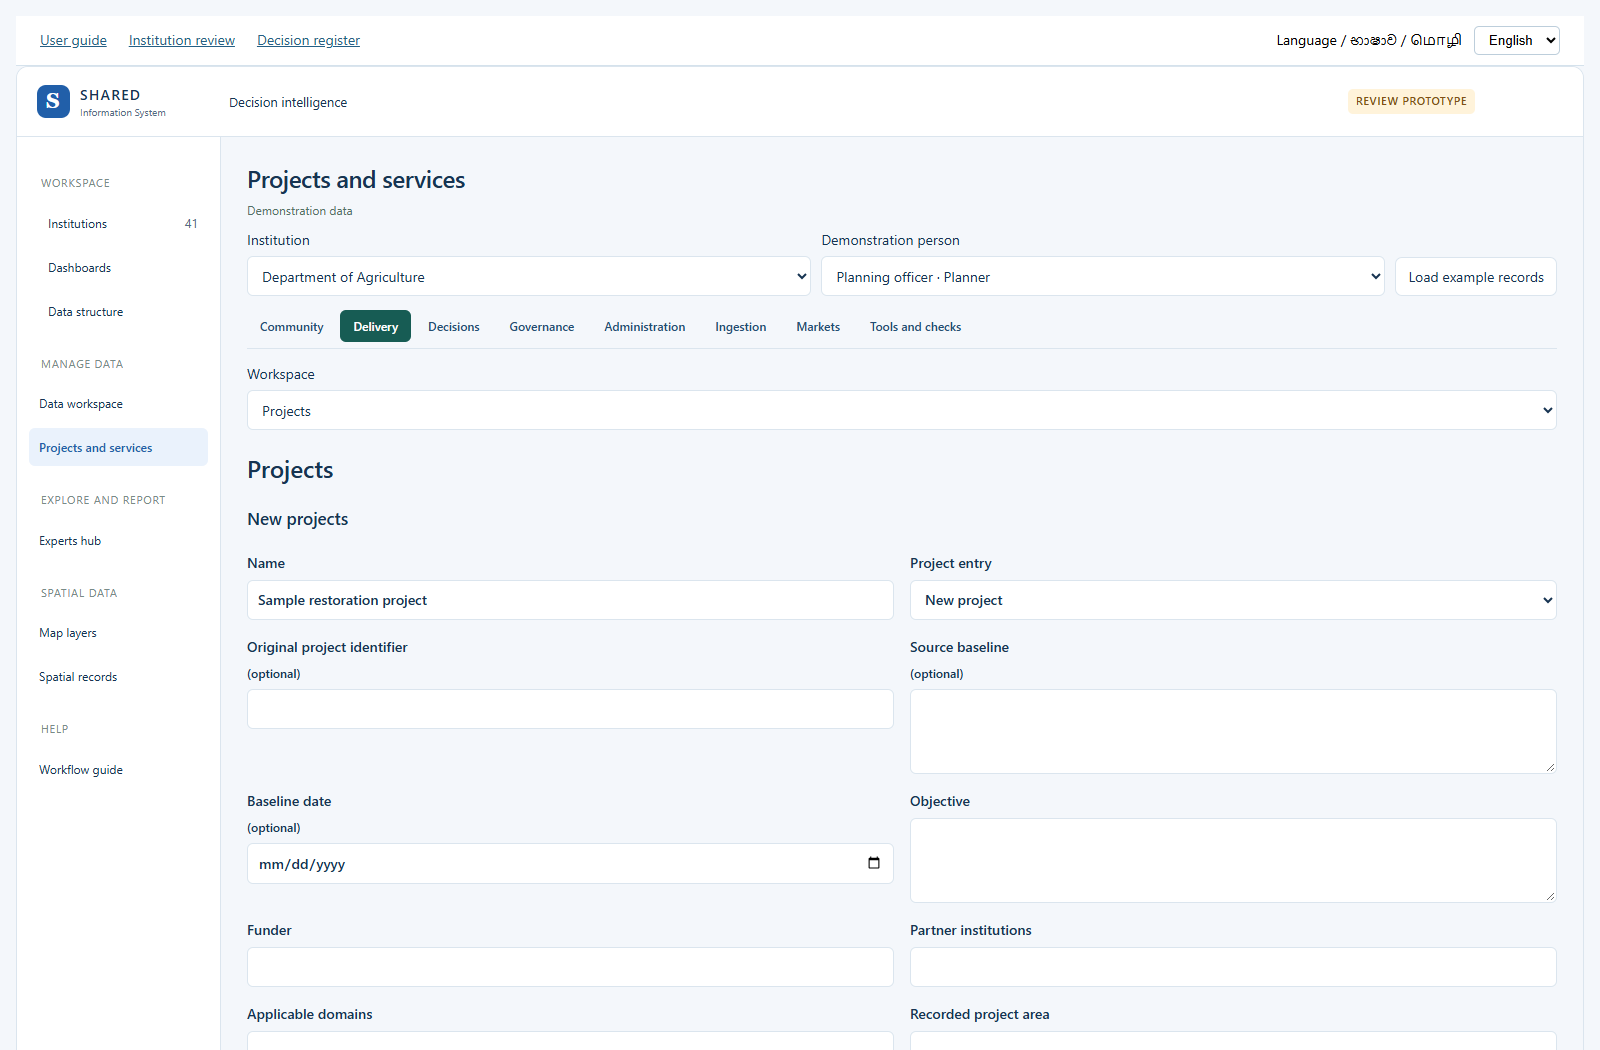
For a project, task or other work record, choose Operational records, then the record name. The system opens its existing form in Projects and services. Fill it and save the draft there. The same record has its review buttons in that workspace. Use the left menu to return to Data workspace. Map records and layer types are under Spatial data.
- Open Data workspace, then Data entry.
- Check the Institution selection.
- Choose the data group, category and form that fit your work.
- Fill the source, place, period, units and values. Required fields must be filled.
- If a value is unknown, use the missing-value reason offered by the form. Do not type zero unless the measured value is zero.
- Save the draft. Read any field checks and correct the entries.
- Open Records & review to continue.
The form lists reuse the existing data structure. Some values are calculated from other fields and should not be entered twice. If a needed form is missing, note it in the review document.
7. Upload a file
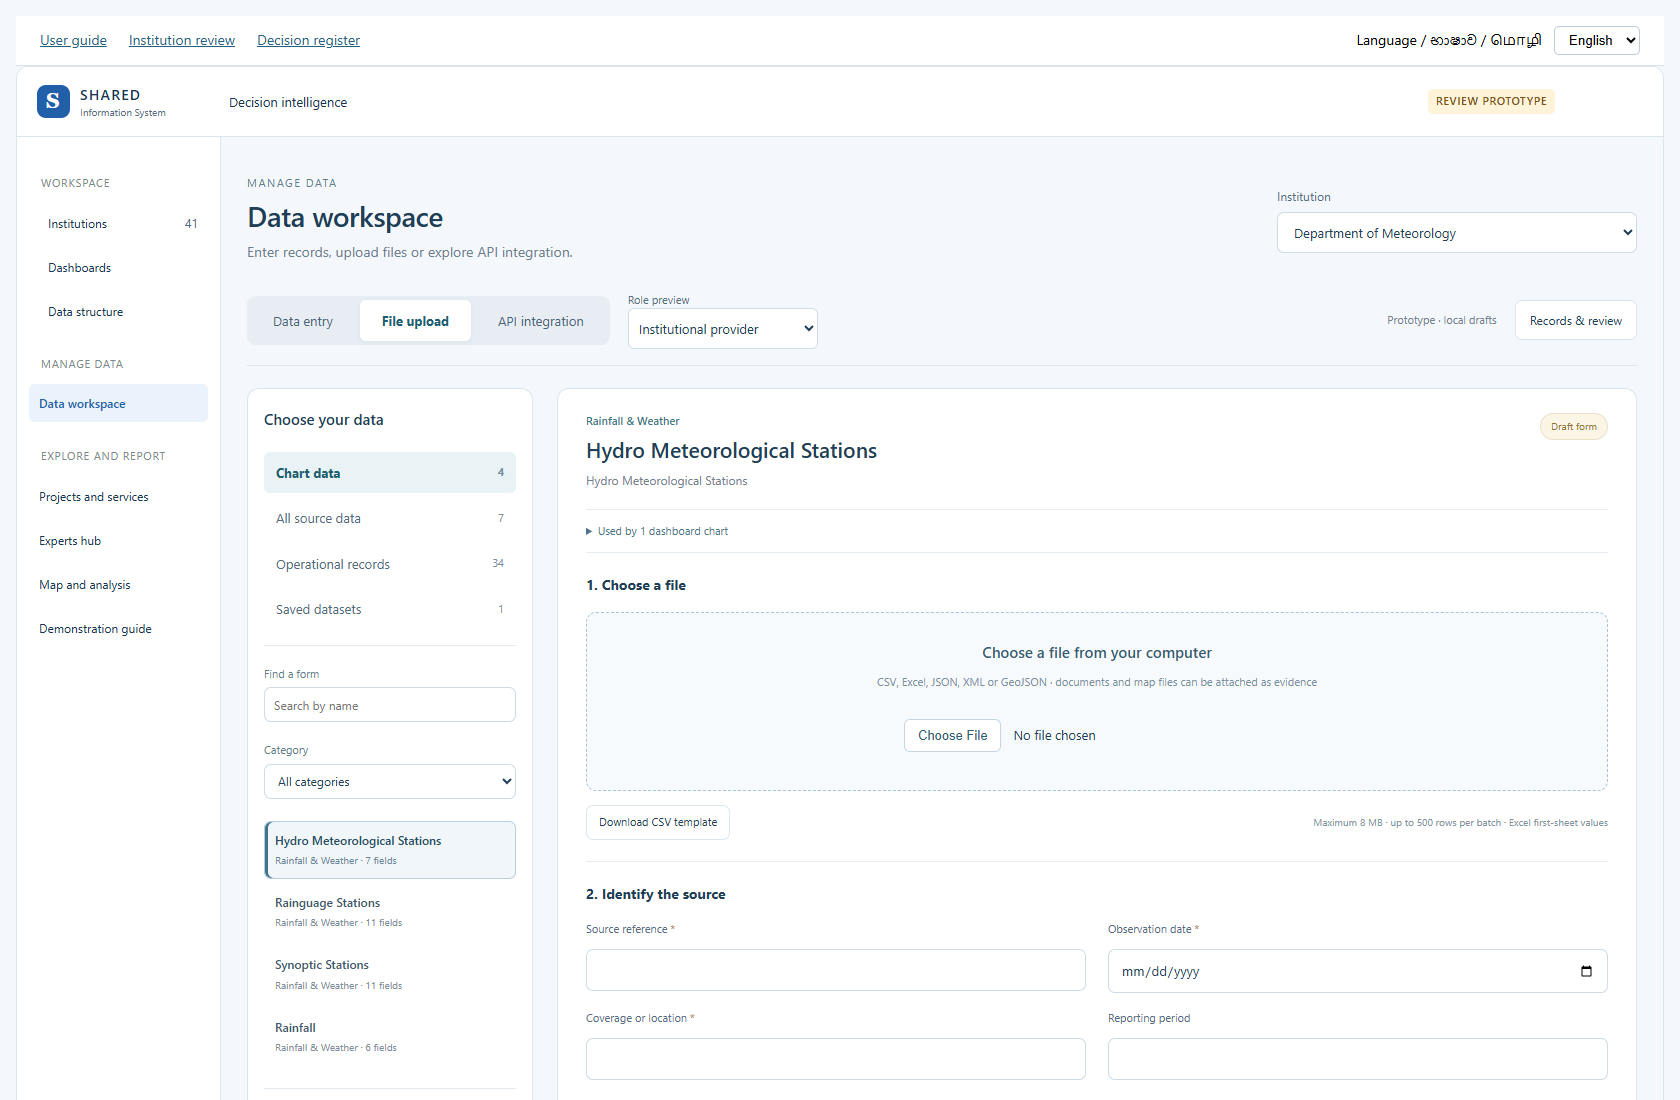
For decision inputs, download the matching form’s CSV template. Include the decision reference and data origin as well as the values, source, place and period. Data origin must say Sample for testing or Institution-supplied data. A file for another institution is rejected.
- Open File upload in Data workspace.
- Choose the institution and matching form. Download its template when available.
- Choose the file and identify its source.
- Match each file column to the correct field.
- Choose Validate & preview. Check errors, units, dates and places.
- Correct the file or the column matches as needed.
- Save the valid rows as drafts, then submit them for checking.
The prototype accepts CSV, Excel, JSON, XML and GeoJSON for record values. The limit is 8 MB and 500 rows per batch. Excel uses values from the first sheet. Try a small file first.
PDF, Word, images and supported map or scientific files can be added as evidence. An attachment alone does not create chart values. Staff must check any values taken from it.
8. Let the document assistant suggest where values belong
A report may contain useful numbers. The Document assistant helps you match clearly named values to fields that already exist. You check the suggestions before using them.
- Open Data workspace, then File upload.
- Choose a PDF, Word (.docx) or text (.txt) file in the file box. The limit is 8 MB; a PDF may contain up to 20 pages.
- In Document assistant, choose Read selected document. For a scanned page or image, paste checked text into Text to check.
- Read the extracted text and compare it with the original file. You may correct reading errors.
- Choose Find matching fields.
- Choose the suggested existing form, or choose another existing form.
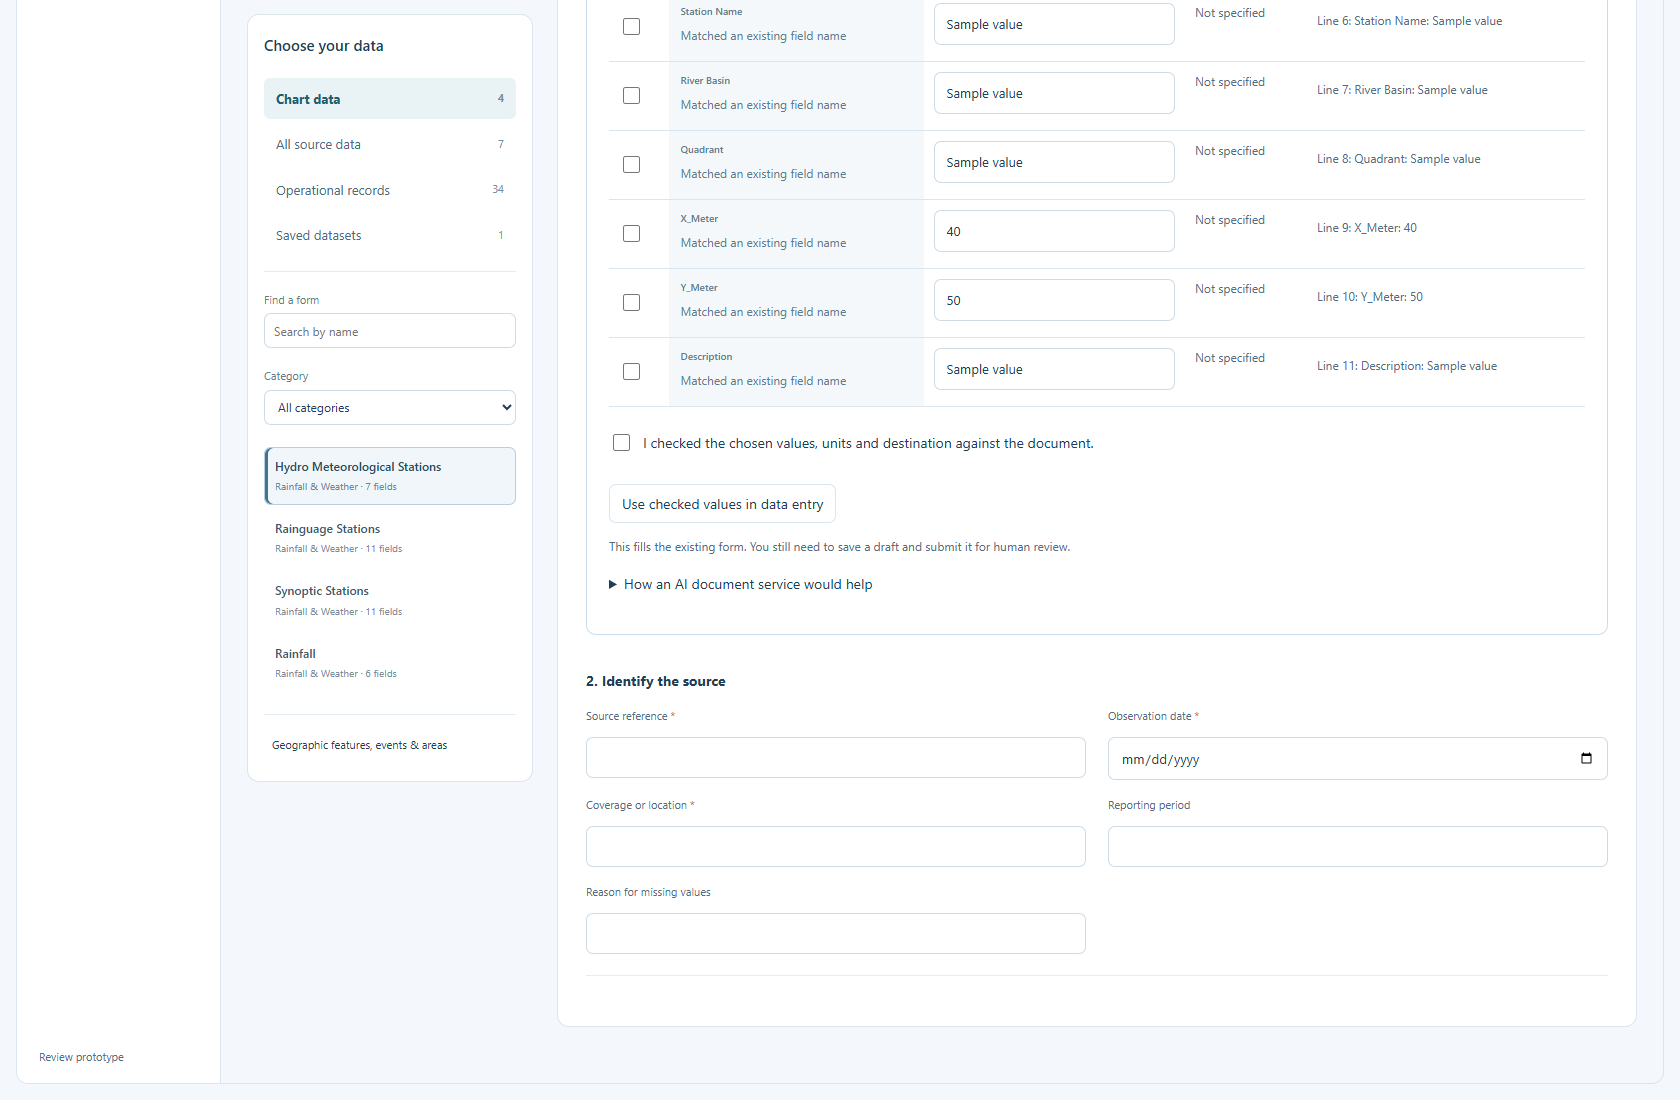
- Read the Destination. It shows the institution, work area and existing form.
- For each suggestion, compare the source text, value and unit. Correct errors and tick only the values you want.
- Tick the confirmation that you checked the values and destination.
- Choose Use checked values in data entry. This fills the existing form; it does not save a record yet.
- Check the source, place, date and remaining required fields. Choose Save draft.
- Open Records & review. Submit the draft for the normal human review. Only the accepted, connected version can feed institution charts.
Try it without a file
Choose Try sample document. It fills made-up text using the current form’s fields. Follow the same checks. The screen marks this as a sample.
If a suggestion is missing or unclear
The local preview matches lines such as Rainfall: 25 mm. It does not understand every paragraph or complex table. If two different values are found for one field, choose the correct one yourself. If a unit differs, check and convert it before keeping the value. If there is no suitable field, record the gap for review; do not create a duplicate field.
How an AI document service would work
A configured service could read more complex text and suggest the existing data slot. It would return the value, unit, source sentence or page, place and date. A person would still check it. Unclear values would stay blank. The service would not approve records or create fields on its own.
This prototype uses local matching. No external AI service is connected. Files and pasted text stay in your browser. This is separate from the API page, which explains computer-to-computer data transfer.
Follow another connected-data example
In System diagrams → More options and examples → Choose a journey, use one of the existing examples below. All use synthetic fixtures.
- Weather packet to Expert Hub: select Run weather intake example. Read the packet receipt, individual observations, duplicate handling and late correction. The latest received packet is not necessarily the latest measurement. No device or warning feed is connected.
- Document table and human correction: choose an Extraction step, then Run extraction example. Compare the candidate with its source evidence. An unreviewed value cannot commit; missing units and unclear places stay unresolved.
- Definition change and impact: choose Change to simulate, then Preview change. Read the effect on mappings and previous records. An optional new field does not fill historical records automatically.
9. Check data before it reaches charts
The review table includes all submitted inputs, units, places and periods. Scroll across the table to check them. After accepting and connecting decision inputs, View institution charts opens the matching decision result. New correction values stay out of the chart and report until accepted.
In Data workspace, choose Records & review. If you have saved the current form, its dataset opens. Otherwise choose a saved dataset from the list. Use All datasets to choose another. A blank list means this institution has no saved datasets in this browser yet; save a draft in Data entry first.
Within a dataset, Values shows its records. The other buttons open its source details, review, access, feedback, status and history. They do not open a second copy of the data. To add a new record or file, use Data entry or File upload at the top.
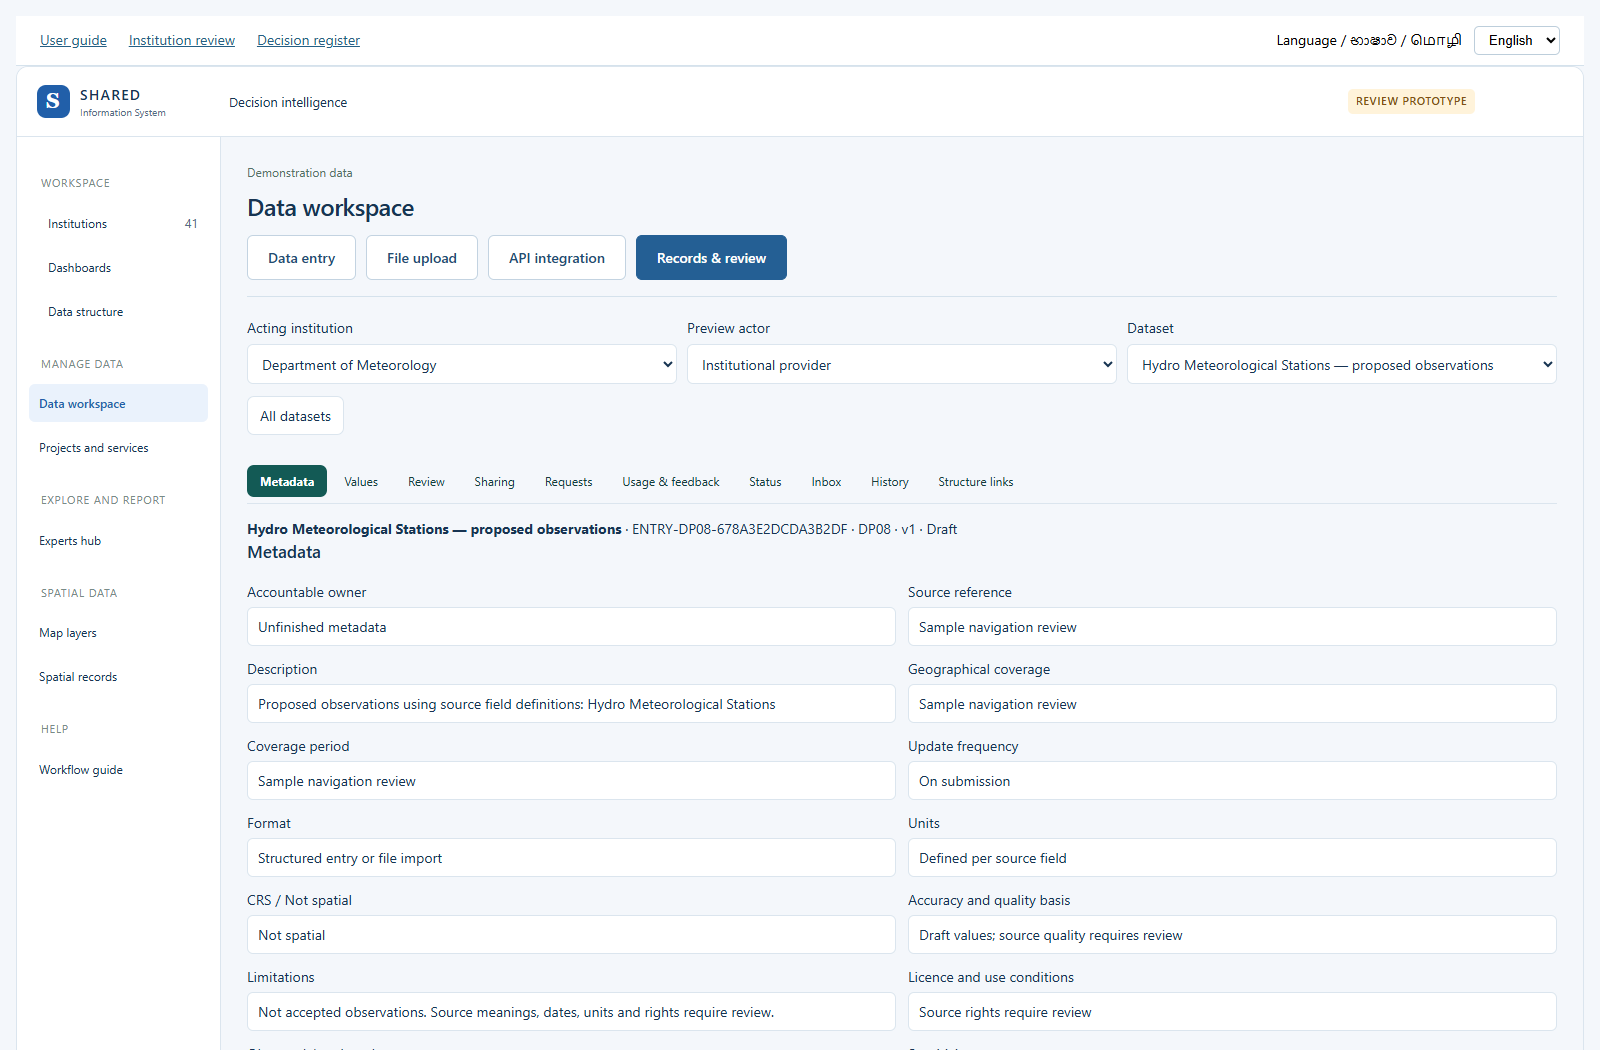
- Open Records & review. Check the dataset name and version number.
- Read the source, values, units, place, period and attached evidence.
- Submit a Draft for review.
- Use Role preview to try the Data steward role. In the real service this would be an authorised officer.
- Complete the quality and field checks and record a reason.
- Approve for institution charts, return it for correction or reject it.
- Where the screen offers Accept & connect charts, complete that step. An accepted version may also need Connect accepted version.
- Open View institution charts. Check that the accepted values and source are shown.
Accepting data for institution charts does not give permission to publish it to everyone. Corrections should be reviewed as a new version. Sample scenario edits are separate from this approval flow.
10. Ask a question and get an answer
- Open Experts hub. Ask a question is the starting view.
- Choose the institution. Type a few words, such as rainfall, water needs or crop loss. Choose the suggested question that matches what you need.
- Choose reviewed decision inputs when available. Otherwise use the clearly marked sample data to try the screen. A sample answer is not an institutional finding.
- Choose an area or option and a period, then select Get answer. The answer explains the comparison and shows the chart.
- Select Report for a question-and-answer report with the supporting table. Open How is the answer calculated? to see the formula, inputs and units.
- Select Save answer. You can find it under Reports in the same Experts hub. Saving the same answer again does not create another copy.
- Use Print / Save PDF or Download table to share a copy. A saved answer keeps the values captured at that time. Get answer again to use the current inputs.
- If the question is not covered, choose Ask an expert. Pick the closest topic, enter your question and use the existing advice-review steps. The system does not invent an expert response.
- For a custom table using reviewed data fields, open Reports, then Build a report from reviewed data. This is the existing report builder.
Institution review documents now ask whether a regular API, file or download can supply the data, how often it can be updated, and what permission is needed. API means a computer connection that supplies data without retyping it. Do not put access keys or passwords in review forms.
Try the rice and weather example
Outcome: compare seasonal rice cultivated area, rainfall and mean temperature for the same reporting years. This connected-data example is in System diagrams; it uses invented values rather than institution records.
Before you start: use the built-in synthetic releases. No institution login, file or permission key is needed. Actual institutional use needs permitted datasets and agreed definitions.
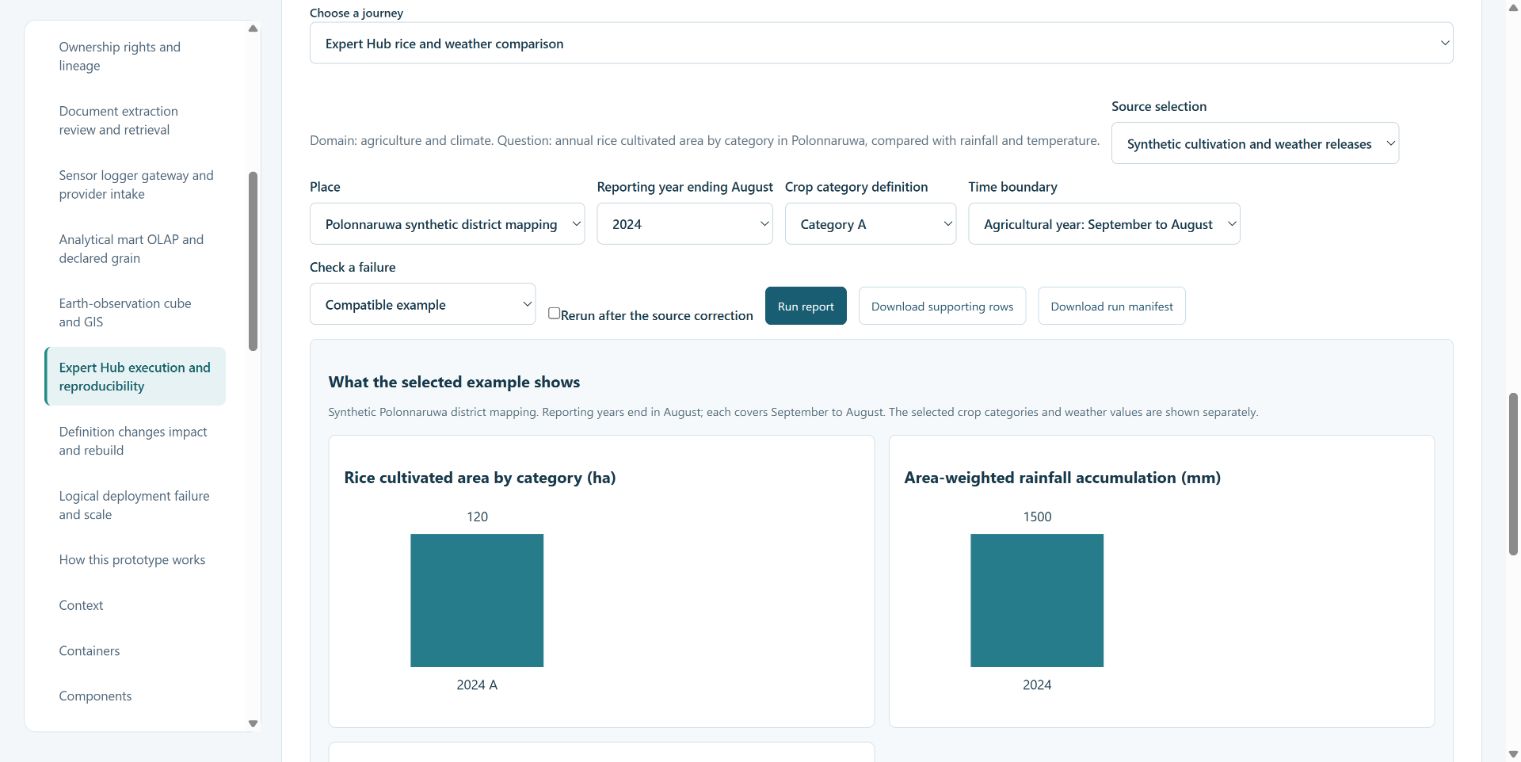
- Open Expert Hub execution and reproducibility. Read Focused view, then open More options and examples.
- In Choose a journey, select Expert Hub rice and weather comparison. The source and place controls show the synthetic releases and Polonnaruwa mapping.
- Choose Reporting year ending August and Crop category definition. Keep Time boundary at Agricultural year: September to August. A year combines Maha ending in that year with Yala in that year.
- Select Run report. The example checks source access, field meanings, category uniqueness, periods and coverage. It totals crop facts separately from weather before combining the annual results.
- Read the three charts and compact table. Hectares, millimetres and degrees Celsius have separate panels. Seasonal area can count the same physical land twice. The synthetic grid weights illustrate coverage; one station is not assumed to represent the district.
- Open All result fields and source coverage for the exact periods, boundary version and coverage. Open Saved report definition and execution manifest for the settings and source versions.
- Use Download supporting rows and Download run manifest. The manifest saves a reproducible definition in the downloaded file; this example has no separate Save report button. Changing a selection disables exports until you run the report again.
Expected example: with all categories and years, the table shows 160 ha, 1,300 mm and 28.5 °C for 2023; 200 ha, 1,500 mm and 29.5 °C for 2024. These are synthetic results. They do not show that rainfall or temperature caused a change in cultivated area.
If a result is missing: use Check a failure to try missing weather, incompatible periods, duplicate categories, restricted sources or ambiguous fields. A missing weather result stays unavailable. A denied report cannot be exported. Restore Compatible example and run again.
Next: read the appendix architecture example for the formulas and source context. For institution data in the main prototype, use Reports and the existing report builder described below.
11. Build a report and check project work
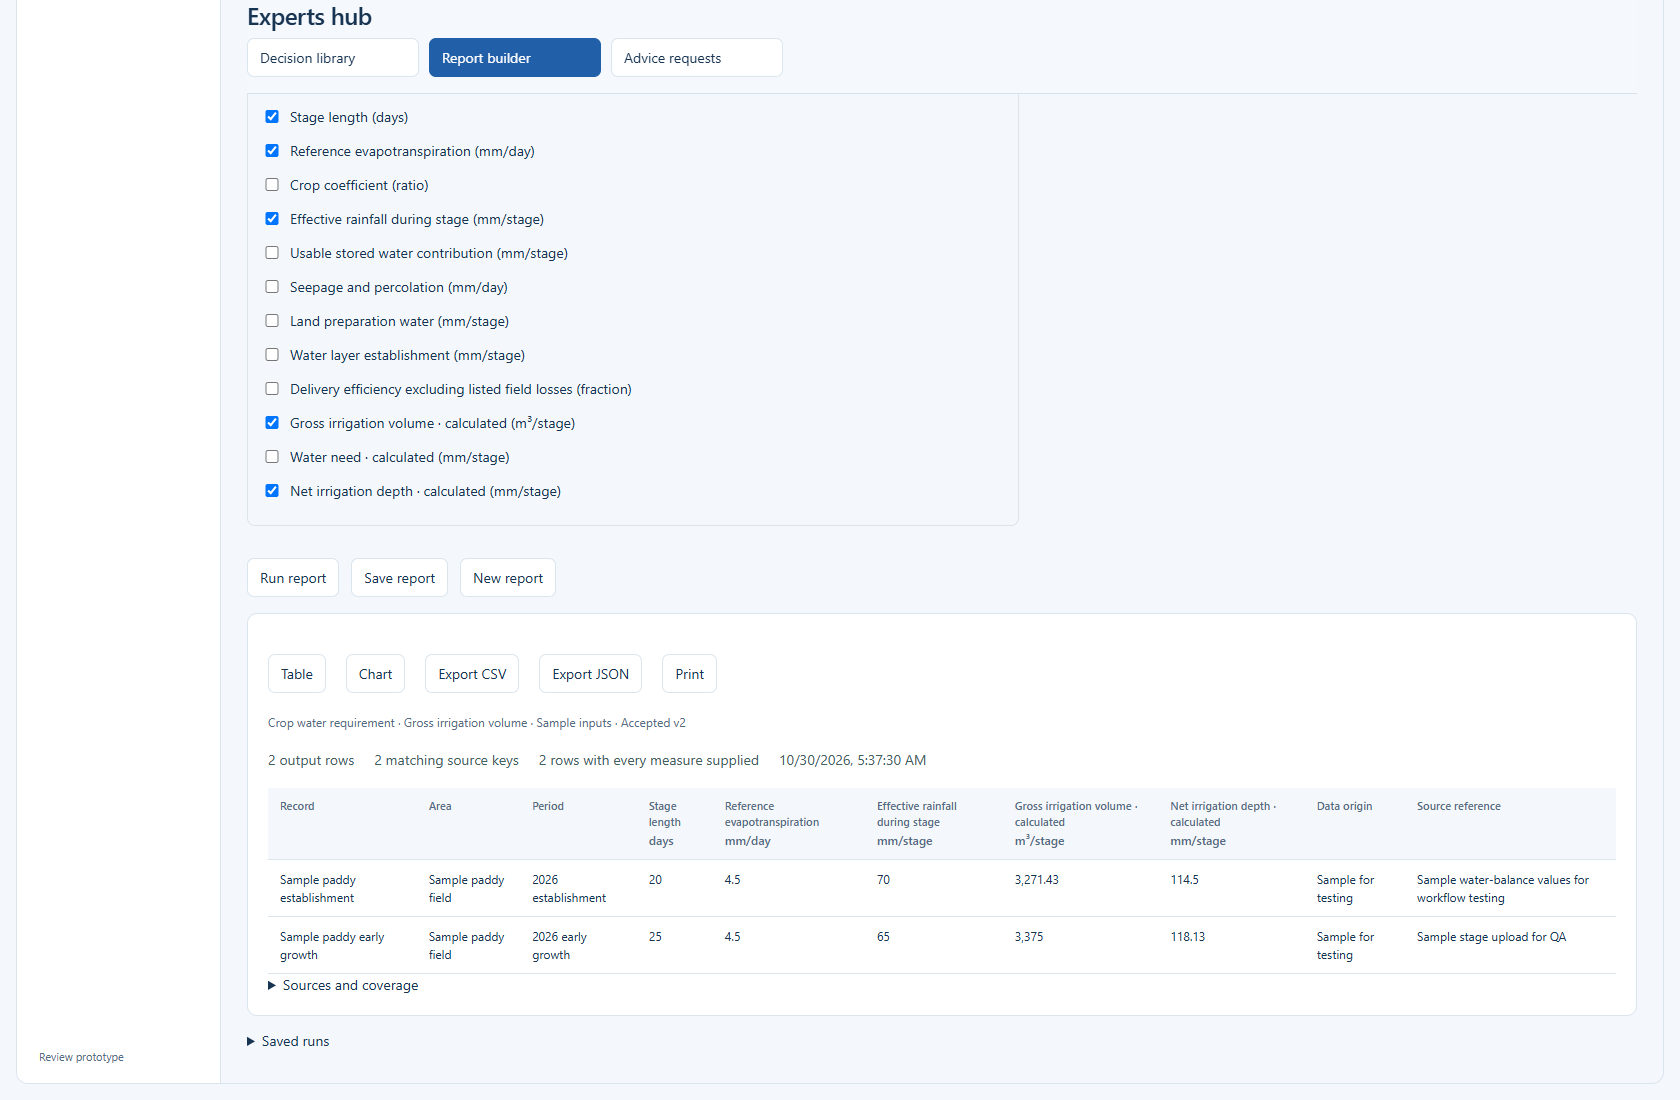
Entered and uploaded datasets appear in new report choices after acceptance and connection. Select the accepted source, choose its inputs or fields marked calculated, and run the report. The water form includes calculated water need, net depth and supplied volume. These use the same calculation as the chart.
Numbers on screen may be rounded for reading. Exports keep the stored numbers. A report keeps its source version. A pending correction is excluded. Data origin is retained so a sample is still clear in the report and export. New reports leave out the old generic demonstration datasets; existing saved reports and runs remain available.
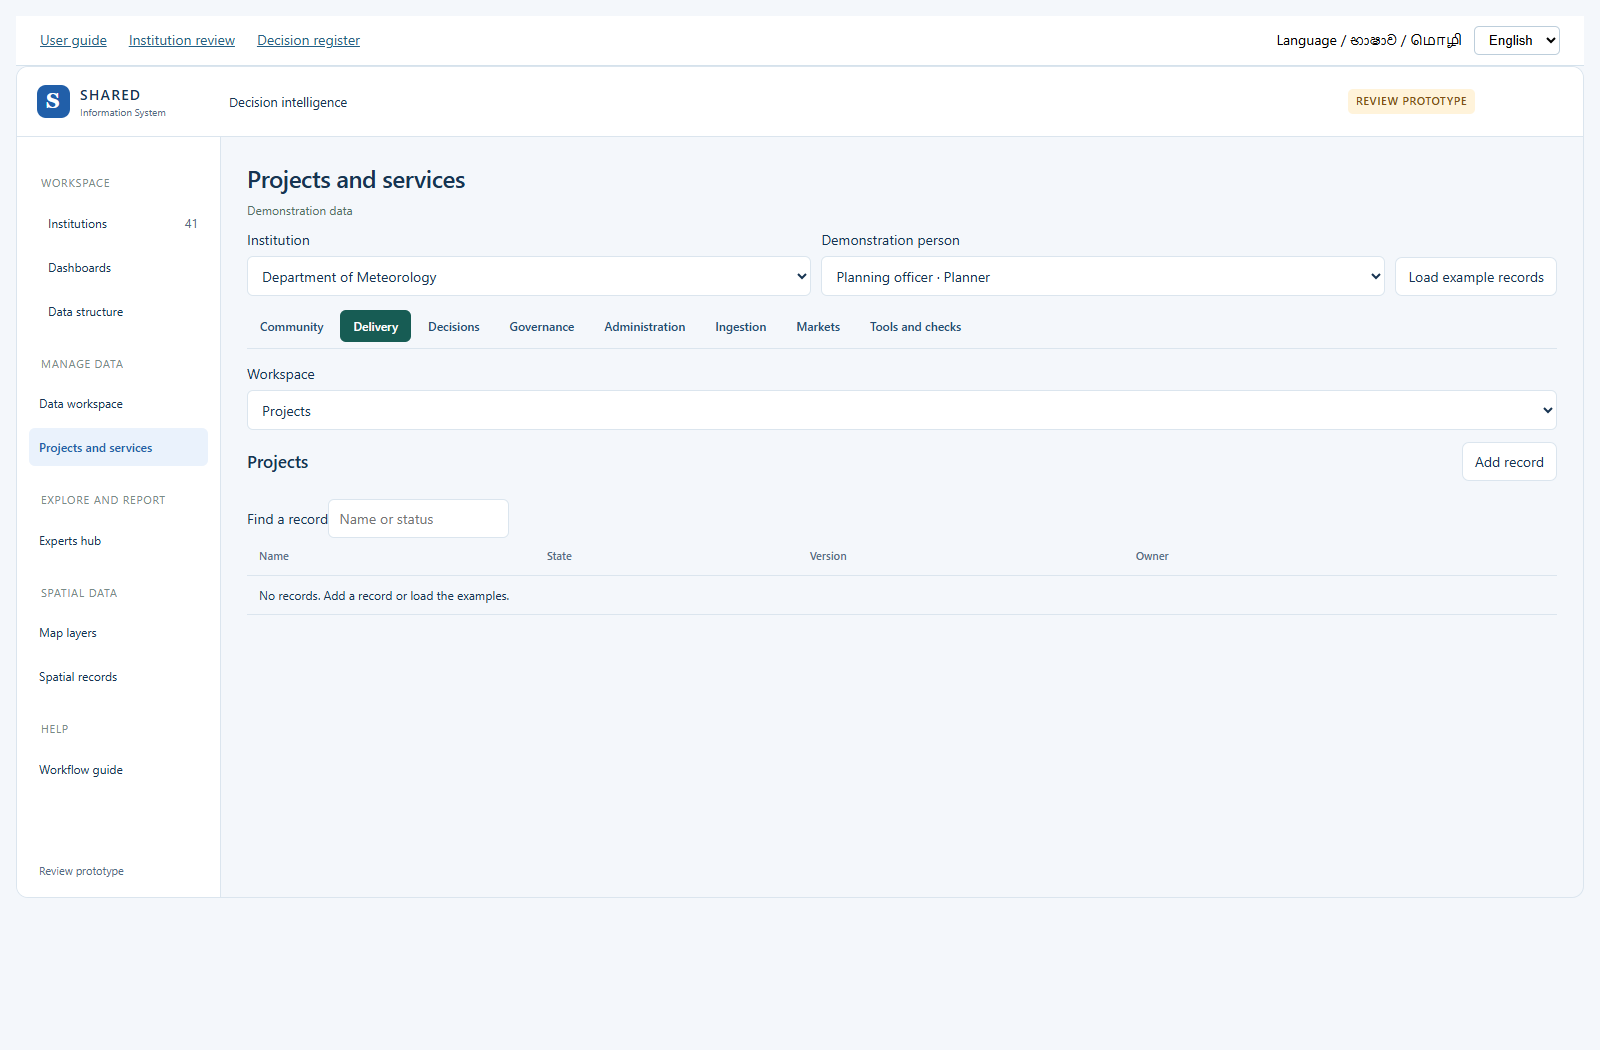
In Projects and services, first choose a work group, such as Delivery or Community. Then use Workspace to choose the kind of work. The page keeps the same main title so you can see where you are. Layer types and map records are under Spatial data.
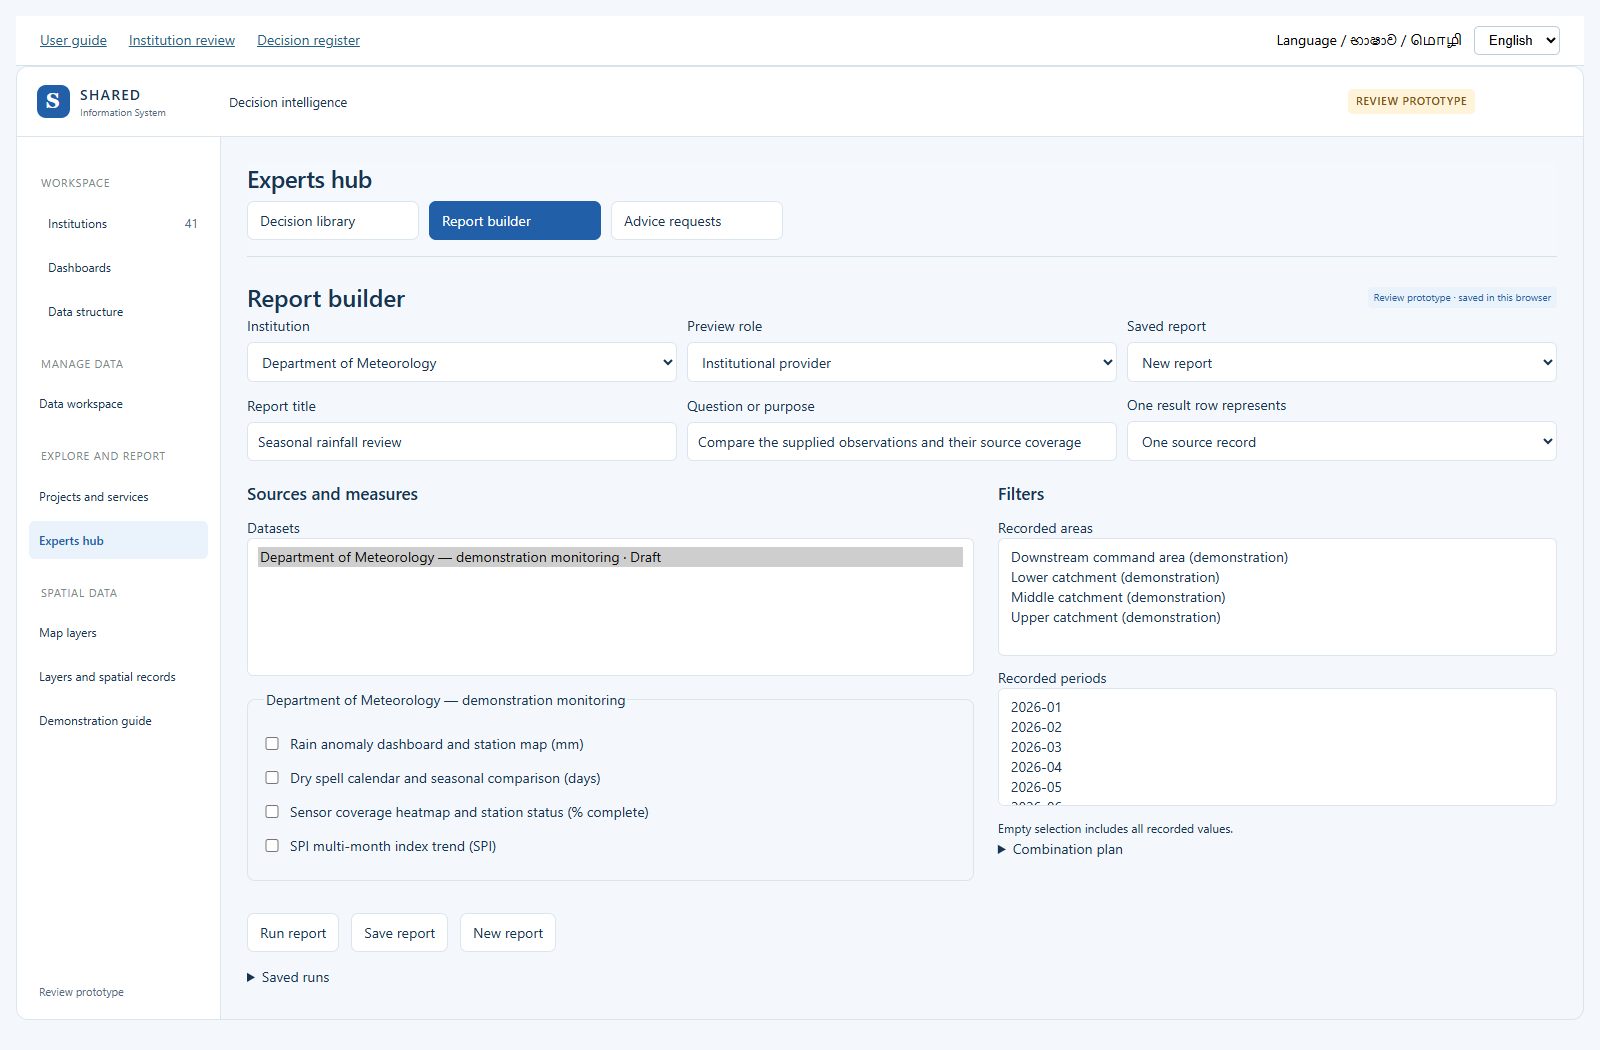
- Open Experts hub and select Reports. Saved answers are at the top. Build a report from reviewed data is open below them.
- Choose the institution and a saved report, or start a new report.
- Enter a title and the question you want to answer.
- Choose what one result row should represent, then select datasets and measures.
- Choose recorded areas and periods. Check how sources will be combined.
- Run the report. Review the result and any missing or unsuitable data.
- Save the report if the result is useful. Check the saved run and use the available output controls.
Use Ask a question to return to the question flow, Reports for saved answers and the dataset report builder, or Expert advice for requests. Your report draft remains while you switch views.
Only combine compatible units, periods and places. A shared name alone is not a safe way to join two records. A saved report definition does not approve its source data.
12. Map layers: see places and their data
Your new map records appear on the Spatial records map. Select Published in its status filter to check the reviewed records. Public preview only shows records that are both published and marked for public access. Internal records stay out of it.
The same four buttons stay at the top: Map layers, Spatial records, Layer types and Review queue. Use them to move between the map and its records. Public preview is available from Spatial records.
A layer is one set of things on a map. For example, one layer can show weather stations. Another can show districts.
- In the left menu, find Spatial data. Open Map layers.
- The map starts with two real public layers. You do not need to sign in to see these snapshots.
- Tick a layer to show it. Clear its tick to hide it. Use Find a layer to search by name.
- Choose Fit visible layers to see the selected places.
- Click a shape or point to read its source information.
- Open Layer sources and dates to check who published the data and when it was copied.
These are existing public-source snapshots. Some shapes are simplified to make the map easier to load. They are not exact survey boundaries or current warnings. A large layer shows up to 2,000 features; the count tells you when only part is shown.
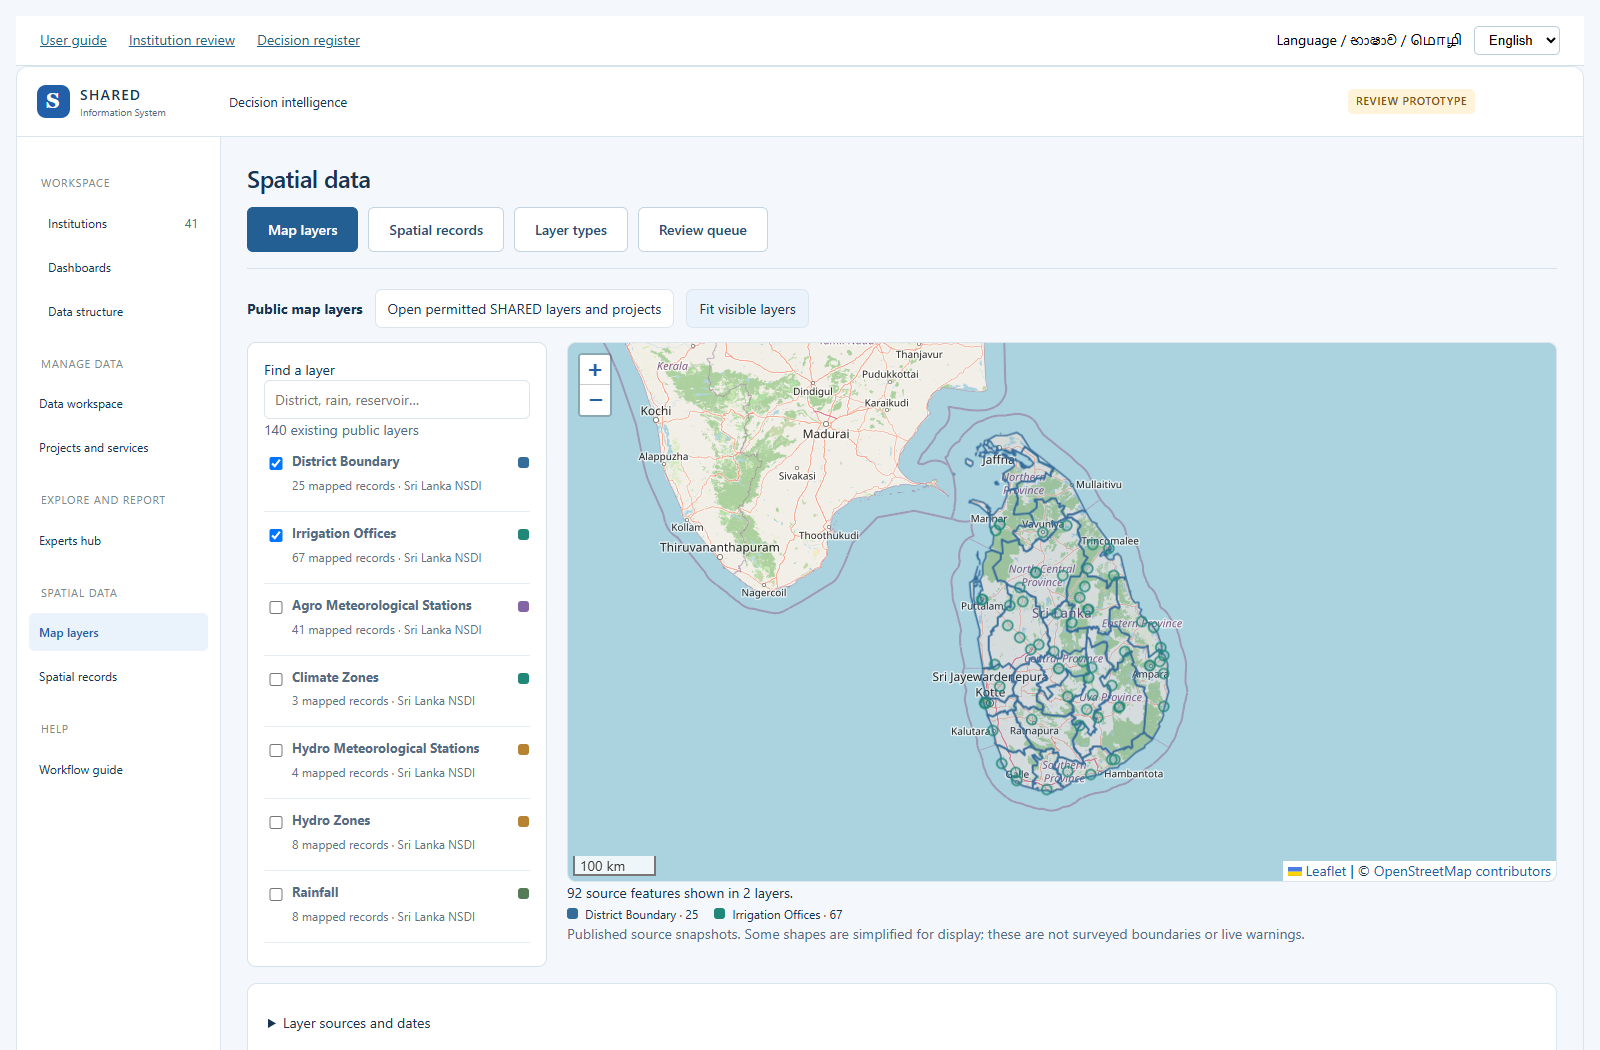
Use the prototype map
Stay in Public map layers or open Spatial records for local examples. Future layer interface shows a proposed connection only. It does not open the real SHARED system.
Try a map calculation
Open Spatial analysis. Choose a small set of layers, an operation and the input features. Enter the distance if asked, then Run analysis. Read the unit and scope with the result. Display shapes and approximate calculations need checking before real work. For a large layer, choose a smaller permitted source selection. Keep session result keeps the result for the current session.
13. Create a layer and add map records
Choose the subject from the selected domain’s existing suggestions. The observation date is visible in the main record form. When you change the preview role, the selected stored record stays open if that role may read it. Back returns to the list.
Use the existing layer tools. Do not make another layer if the right one already exists.
- Under Spatial data in the left menu, open Spatial records.
- Choose Layer types at the top. Look at the existing types first.
- To test creation, choose a Steward under Demonstration person. This role choice is only for the prototype.
- Choose Create layer type.
- Give it a clear name. Choose the existing base domain and subject.
- Choose the shapes it can contain: Point for a place, LineString for a route, or Polygon for an area.
- Choose its map colour and who may see the data.
- If you need details such as a measurement, choose an existing attribute and Reuse attribute. Enter its unit and rules.
- Save draft configuration. The layer type still needs checking before it can be published.
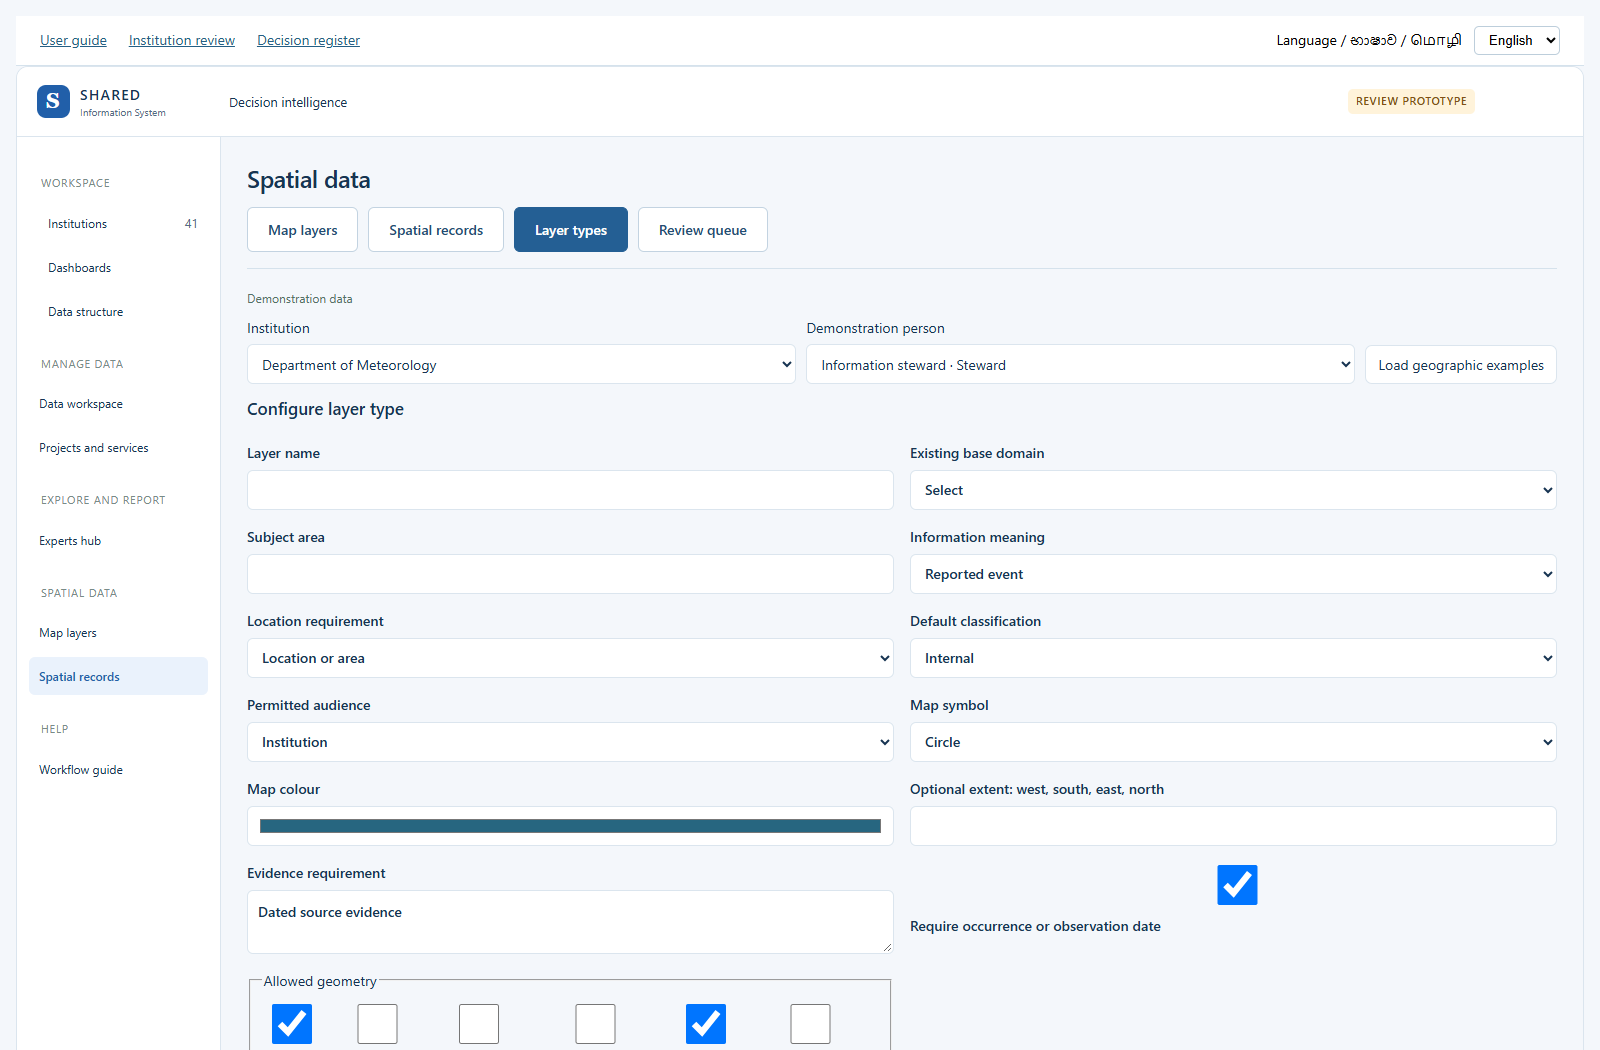
Add a place or shape to the layer
- Choose Spatial records at the top, then Add geographic record.
- Choose the layer type. Enter the name, source and original source reference.
- Enter the relevant date. State whether the location is known, approximate or unknown.
- Add a coordinate point, draw on the map, import GeoJSON, or reference a permitted SHARED feature.
- For a point, longitude means east/west and latitude means north/south. Use the values from the source. Do not guess them.
- Keep the geometry, then save the draft record.
- Use Review queue to check and approve it through the existing workflow. The exact layer configuration must be published before its records can pass submission.
If you only know a village or district, keep it as area context. Do not draw an exact affected area from that information. A draft layer or record is not an official map. Reusing the same layer name or original source reference should not create another copy.
14. Documents and images
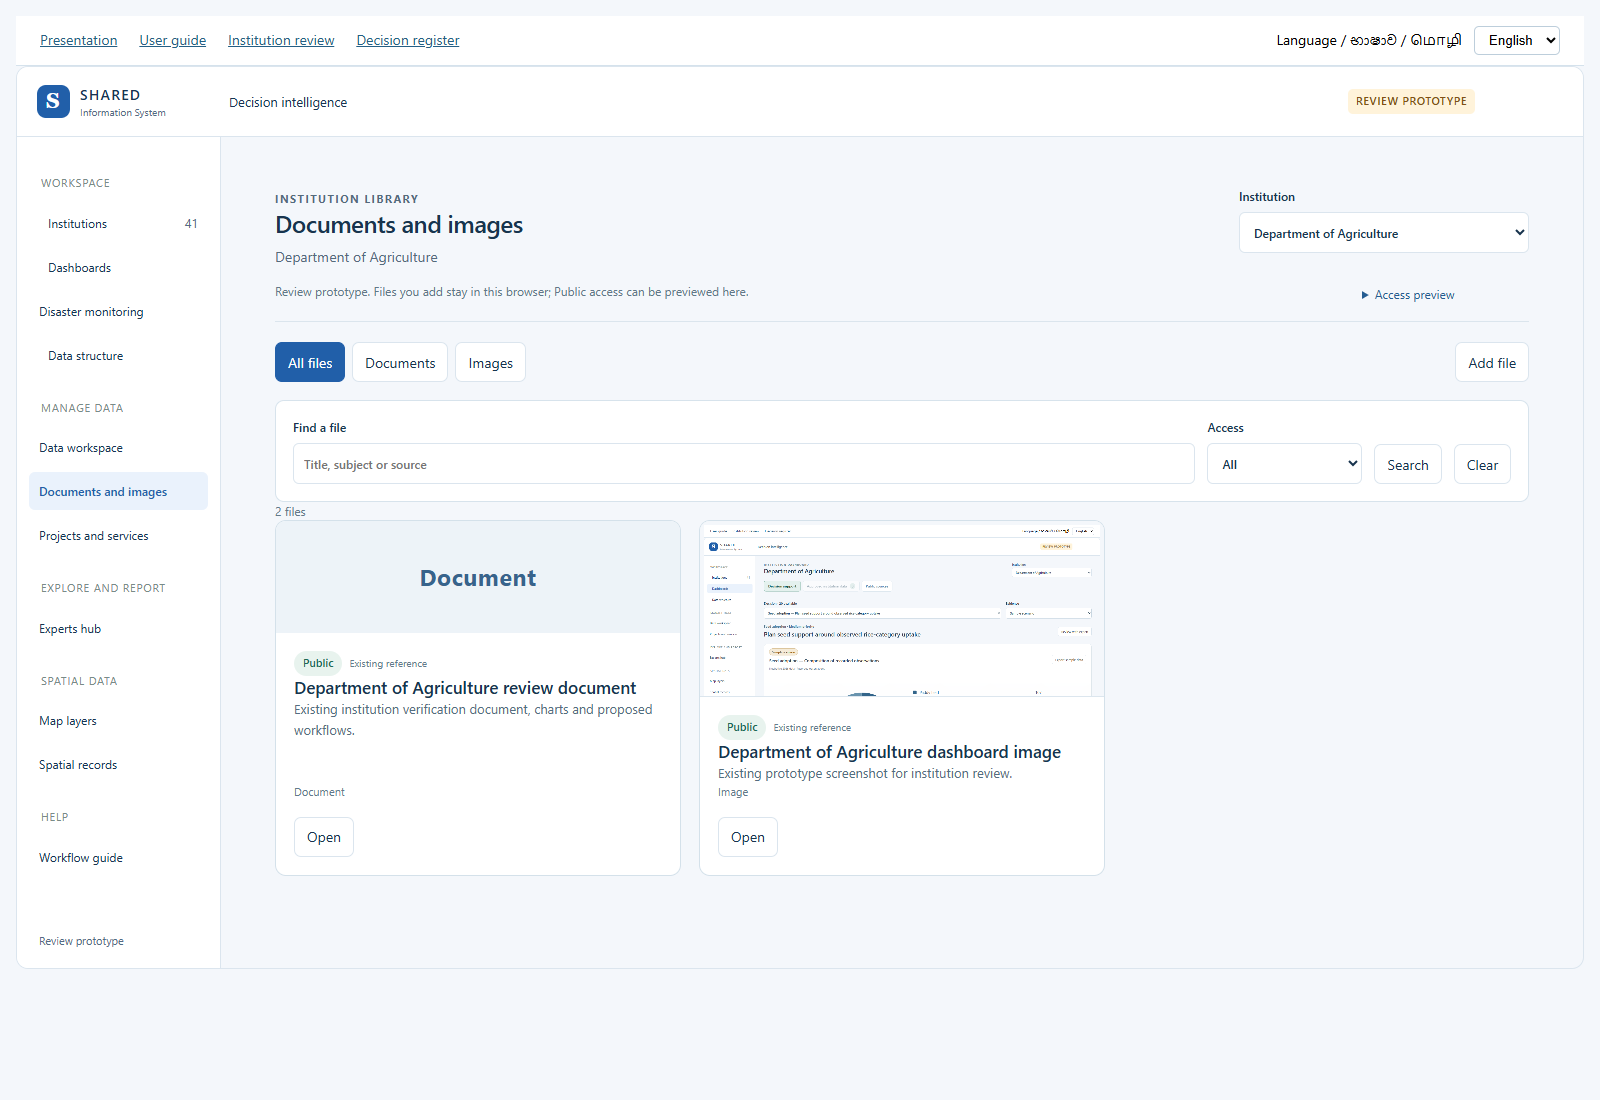
- Open Documents and images in the side menu. Choose the institution. Each institution has its own library.
- Use All files, Documents or Images. Search by title, subject or source. Public requests appears when previewing the institution reviewer.
- Select Add file. Choose a file up to 8 MB. Add a clear title and optional subject and description. The existing file storage is reused.
- Private is the default. In this access preview, only the owning institution team can read a Private file.
- To request Public access, choose Public and enter the source or owner and permission or licence to share it. Save file sends the request for review. The file remains Private.
- Open Access preview and choose Institution reviewer to demonstrate the review. Open the Public request, check the source and publishing permission, enter a reason and approve or return it. The same preview actor cannot review its own request.
- Choose Public visitor to check the public view. Only approved Public files and existing public references appear. Private titles, counts, previews and downloads are not shown to this viewer.
- Open a file to preview an image, read the text of a PDF or Word document, download the original, or open an existing public reference. A text preview does not preserve the original page layout.
- Edit details to change access. Changing a Public item to Private takes effect immediately in this preview. Other edits require a fresh Public review. Previously downloaded copies cannot be recalled.
- The same file added again to the same institution reuses its existing library item. Archive hides an item without deleting its file or history. Use Archived files to restore it as Private. Existing dataset attachments are read only in the library and remain under their original dataset.
Prototype storage: uploads and review decisions stay in this browser on this website address. Public is an access preview here; it does not upload files for other visitors. For real sharing, connect this screen to the existing protected SHARED document and image service, with signed-in institution access, server permission checks and file safety checks. No real system record or permission is changed.
Try the Department of Agriculture library
15. User management preview
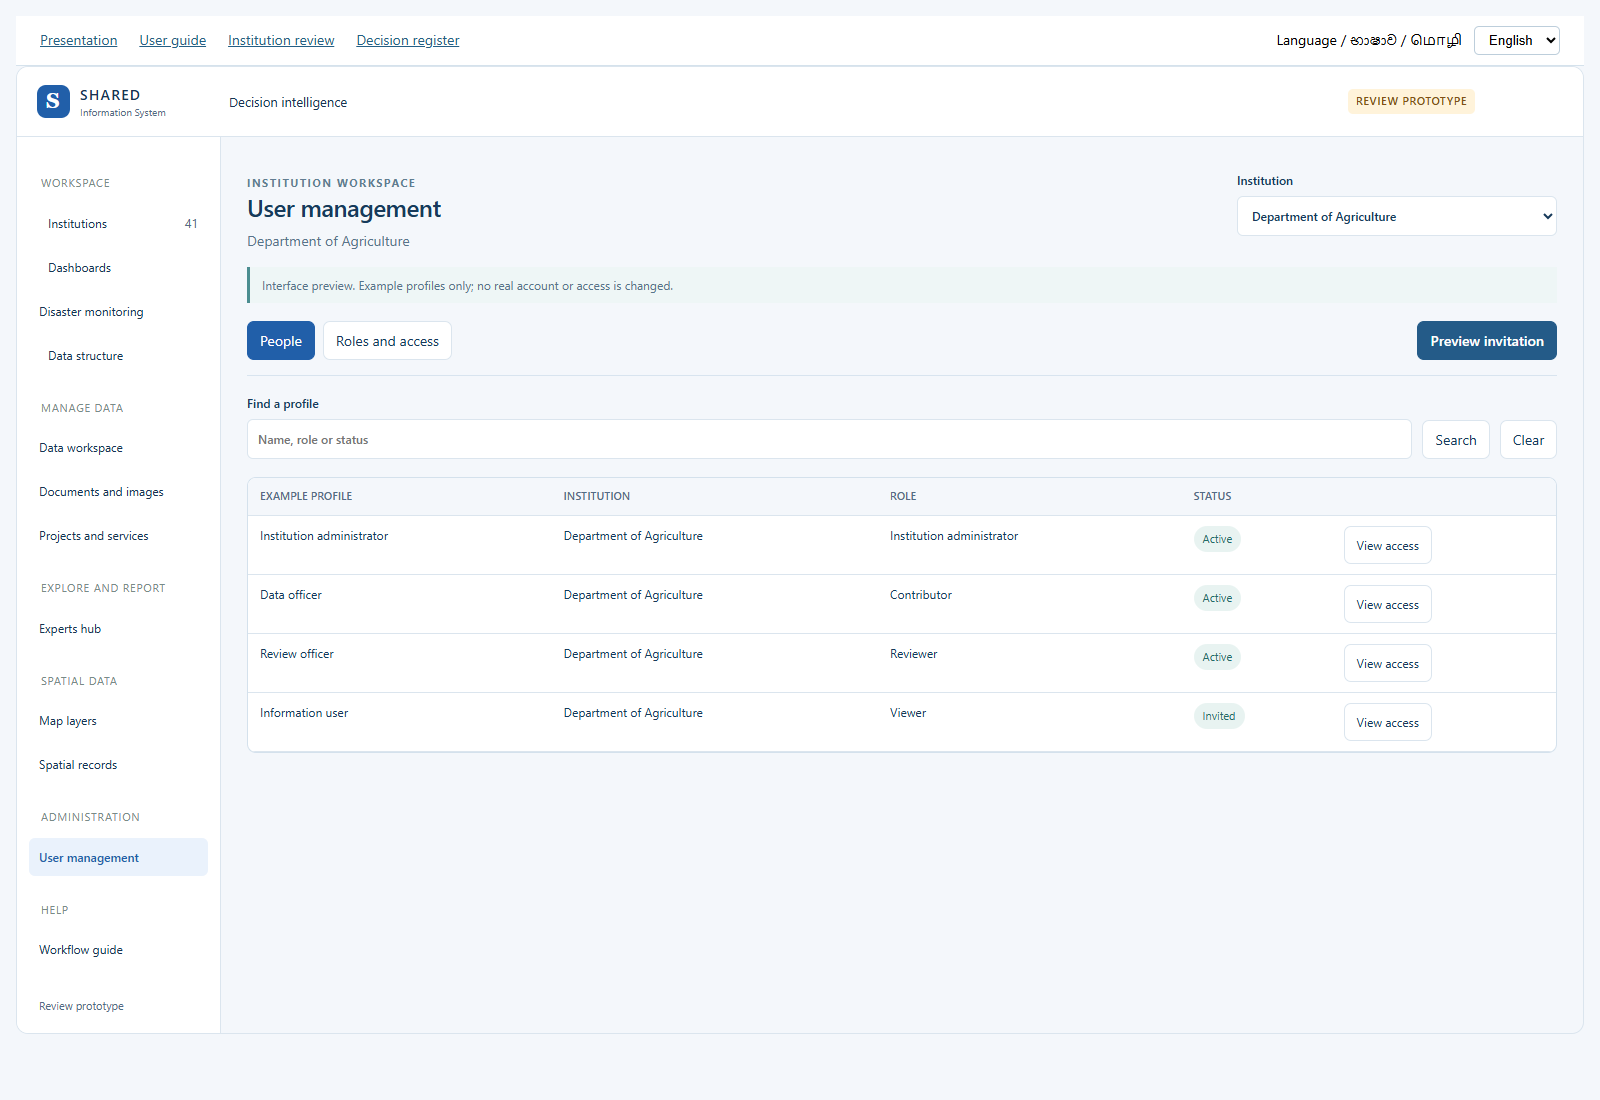
- Open User management and choose an institution. People shows clearly labelled example profiles.
- Use Find a profile to search by name, role or status. View access opens Roles and access for that example.
- Choose a role to see what it would allow. Private-file access is a separate permission; an administrator title alone does not grant it.
- Select Preview invitation. Enter a name, email, role, start date and reason. An optional end date limits the proposed access period.
- Preview invitation shows the proposed details. It does not create an account or send an email. Example-profile access changes are also previews only.
No user administration service, account, invitation, password or permission is created or changed. Do not enter a real password in this demonstration. Form entries remain on the current screen and are not sent to a server.
Open the user management preview
16. Disaster monitoring
Open Disaster monitoring in the side menu. Everyone can view this public prototype. It does not change the real SHARED system.
- Choose the area. The starting view uses Kandy and Matale as broad Knuckles context. It is not an approved project boundary.
- Choose a district, DS division or available GN area. Boundaries are source display outlines, not hazard footprints. Some source-code matches still need review.
- Click a map point or an Open button. The details panel shows the source, date, last checked time and value, where available. For a report, select Open report to read the official advice and affected places. Technical audit details are kept out of this panel.
- Water-level charts use genuine source records. A threshold line is a published gauge reference, not an issued flood warning. Unverified scales are excluded from threshold arithmetic.
- Use Warnings for CAP records and actual DMC bulletin links. Empty feeds or missing records do not mean all clear. A bulletin title alone is not treated as an active warning.
- Rainfall and forecast charts are marked as model data. They do not represent measurements at every village.
- Open Source health for all 45 sources. A key, permission or licence requirement is shown where needed. Demo previews use invented examples with a large Demo data label. They never enter real counts.
- Use Reload published data to read the latest collected snapshot. Check its date. The open dashboard checks for a newer published file every five minutes. A collector on the review operator’s PC collects and publishes every 30 minutes while that PC is awake and online. If it stops, the last successful records stay visible with their original dates. This is not a continuously guaranteed warning service. Source health also lists available public reports and data downloads; these links are not treated as live measurements.
- Use Export source records for source-identified gauge data. Existing Data workspace handles entry, upload and human review. Existing Experts hub contains the report builder; the review prototype does not approve institutional data or a scientific method automatically.
Open disaster dashboard · Source information
Read charts, maps and reports together
- Choose your area, then choose Flood & water, Landslides & rain, or Drought & forecast. The matching map opens beside the chart.
- Click a bar or a point in the chart. The map highlights that same record. You can also select a point on the map. Use Fit selection to return to your chosen area.
- Rainfall and forecast points show where the model data comes from. They are not measurements for every village. A report without a confirmed place does not get a guessed map point.
- Under Official reports, select Read report. The actual report pages open above the list, beside the map.
- Use Next page, Previous page or Enlarge page to read the report. Open original PDF takes you to the issuing website.
- Some situation reports also show affected families, people and houses for your selected districts. These figures come from a checked table in that dated report. They are not live warnings.
- Select See all districts in this report, then Show area to change the map to a listed district. Shading shows the whole district, not an exact affected site.
- The date printed in a report can differ from the date on the report list. Both are shown when the printed date can be read reliably.
17. Understand automatic data transfer
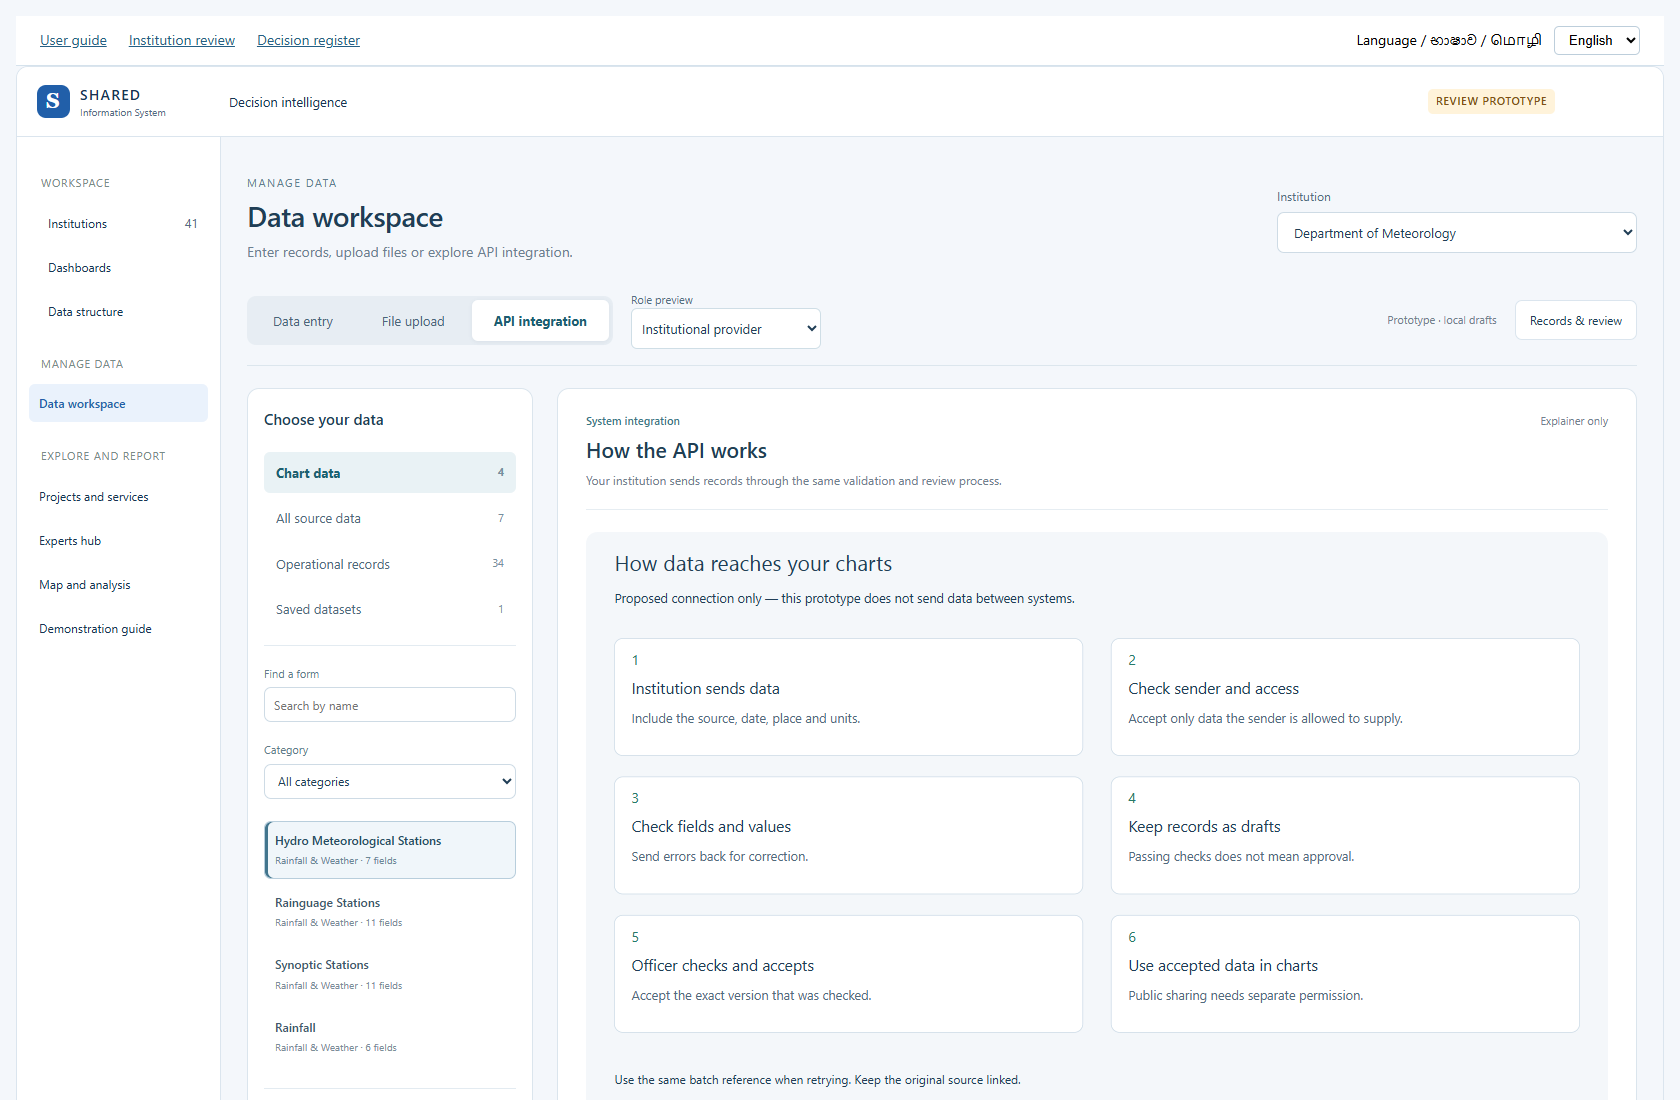
Open API integration in Data workspace. An API is a way for one computer system to send data to another. This page explains the proposed process with a diagram; it does not make a live connection.
- The institution prepares records with their source and version.
- SHARED checks the sender and what that sender is allowed to supply.
- The fields, units, places and dates are checked.
- Valid records wait as drafts.
- An authorised officer checks and accepts the exact version.
- Permitted charts and maps can use the accepted records.
Errors return for correction. Sending the same batch again should not create duplicate records. Agree the data owner, update times, field list and failure contact before building a real connection.
18. Complete your institution review
- Open Institution review documents and choose your institution.
- Fill your role and review date. Your name is optional.
- Open each of the 20 decisions. Follow its prototype link.
- Check the data, worked example, rule, action and responsibility.
- Choose Correct, Change needed, Not needed or Cannot confirm for each question.
- Write the correction in your own words. Include an example if useful.
- Check the existing form list and add missing work, fields and sources.
- Download answers. Keep the file for your meeting or share it through your agreed channel.
Answers save in this browser when storage is available. Download a copy before changing computer or clearing browser data. You can load that file back into the same institution’s form. It cannot be loaded into a different institution’s form.
Use Print / Save PDF for the whole document, or Print this decision for one decision. Your answers appear in the printout. Nothing is sent automatically, and the form does not approve or change records in SHARED.
19. Check the language and tell us what is unclear
Choose English, සිංහල or தமிழ் at the top of the prototype. Changing language keeps the current screen and entered values. Numbers, units, record IDs and source references keep their meaning.
Core buttons use everyday Sinhala and Tamil. Longer decision text still needs local wording review. Official source titles and source data may remain in their original language.
| English | Sinhala | Tamil |
|---|---|---|
| Decision support | තීරණ ගැනීමට සහාය | முடிவெடுக்க உதவி |
| Data entry | දත්ත ඇතුළත් කරන්න | தரவு சேர்க்கவும் |
| Experts hub | විශේෂඥ සහාය | நிபுணர் உதவி |
| Draft | තවම පරීක්ෂා කර නැත | இன்னும் சரிபார்க்கப்படவில்லை |
In the institution review form, give the screen name, unclear word and your suggested wording. This helps us use the words staff actually use at work.